
The power of candlestick signals in the markets can be traced back to the 16th century.
Candlesticks were used back then, just as they are today,
by technical traders and analysts to read market behaviour,
which is heavily influenced by supply and demand, as well as emotions like greed and fear.
We will first take a brief dive into the history of candlesticks, and then
I’ll show you four powerful candlestick signals that still work today—signals I personally use to identify high-probability bullish or bearish entries.
History of Candlesticks: The Power of Candlestick Signals
In the 18th century, a legendary Japanese rice trader named Munehisa Homma developed the Japanese candlestick method to track price movements.
It is important to note that during this time, the rice market dominated the financial markets.
Rice was so significant that it played a major role in Japan’s economy.
Munehisa Homma’s early work on candlestick charting, which incorporated
human emotions such as greed and fear, market behaviour, and even weather conditions, dates back to the mid-17th century during the Edo period.
The Power of Candlestick Signals Invented by Homma
It is important to note that the candlestick patterns created by Munehisa Homma continue to help technical traders today by providing a visual representation of the market.
These patterns offer signals that help traders determine areas of high or low bullish and bearish activity, as well as potential reversals or continuation zones.
Historical records indicate that Homma developed these candlestick patterns based on his Sakata Rules.
Some of the candlestick patterns he introduced might sound familiar, such as the Doji, Hammer, Engulfing, and Spinning Tops, among others.
If these patterns are new to you, don’t worry—I’ll be covering a few of them that I personally use to gain an edge in the market.
The Power of Candlestick Signals: 4 Powerful Candlestick Patterns
Now, we dive into four powerful candlestick patterns that I use to achieve highly accurate price predictions in the market, allowing me to yield rewarding long-term returns.
But before we do that, let’s define what a candlestick is and what it consists of.
By understanding the anatomy and psychology of candlesticks,
it’s like visiting a foreign country and being able to communicate in its language.

Having this ability allows you to navigate that country with ease,
unlike relying on time-consuming methods to find your way around.
The same applies to technical trading—when you understand the language spoken by candlesticks,
you can navigate price movements with greater confidence and accuracy.

What is a Candlestick?
A candlestick, as I mentioned earlier, is a visual representation of price movement,
available across different timeframes (4-hour, 1-hour, 30-minute, etc.).
Candlesticks provide valuable information, including the opening price,
closing price, highest price, and lowest price over a specific period.
For those unfamiliar with candlestick structures, I will provide a video link later in this blog to illustrate how they appear.
I use candlesticks in combination with trends, key levels, and support and resistance zones.
You will see exactly how this works when I discuss pattern formations for entries.
Another key aspect to pay attention to is the colour scheme of the candlestick.
When the bulls (buyers) are in control, the candlestick typically appears white or green.
When the bears (sellers) are in control, the candlestick is usually black or red.
Personally, I use the green/red colour scheme, but the colours can be customized to your preference—it doesn’t really affect the analysis.
Benefits of Using Candlesticks Over Other Chart Types
One major advantage of using candlesticks instead of other chart types,
such as line charts or bar charts, is their compatibility with trendline strategies and support or resistance zones.
A technical trader who understands candlestick patterns can capitalize on market reversals,
such as bullish engulfing patterns forming at a support zone.
These patterns provide strong buying signals, indicating that sellers
have exhausted their momentum and that strong buying pressure is about to take over.
As you will see, my ability to read candlestick patterns gives me an edge in uncovering hidden market signals.
Take note: If you lack the ability to read candlesticks, it will be much harder to spot these signals and make informed trading decisions.
The Power of Candlestick Signals: 4 Powerful Candlestick Patterns
Now, let’s explore four candlestick patterns that I use to anticipate future price movements.
By understanding these patterns, you will be able to spot high-probability
reversal entries and continuation-based buying and selling opportunities.
Bullish Engulfing Pattern
The bullish engulfing pattern is one of my favourite candlestick patterns for capitalizing on strong bullish momentum.
There are two key ways I use this pattern for high-probability trade setups:
- Reversal Setup: I look for bullish engulfing patterns forming at support areas (law: we buy at support) within a zone or trendline.
- Since bullish engulfing patterns act as reversal signals, their presence at key support levels increases the probability of a successful trade.
- Continuation Setup: I also use bullish engulfing patterns when looking for market continuations. For example, when price breaks above resistance, a break-and-retest scenario may turn previous resistance into new support. If a bullish engulfing pattern forms at this retest area, it signals strong buying activity and a potential continuation of the uptrend.
How a Bullish Engulfing Pattern Forms
A bullish engulfing pattern consists of two candlesticks:
- The first candlestick is small and bearish (indicating weak selling pressure).
- The second candlestick is large and bullish, fully engulfing the first one (indicating strong buying momentum).
Example of a Bullish Engulfing Trade setup
In the diagram of my trading setup:
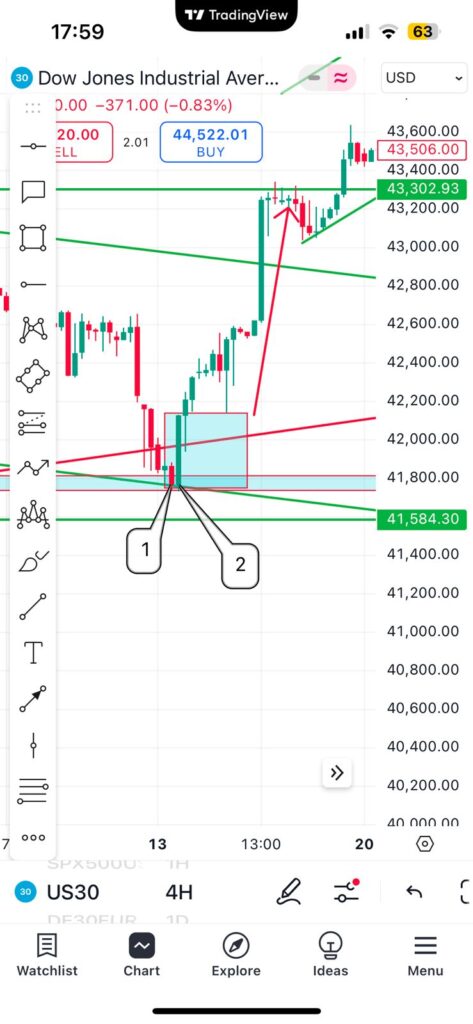
- Candlestick 1 was a bearish candle that touched the support zone and support trendline.
- Shortly after, Candlestick 2 fully engulfed Candlestick 1 with a strong bullish candle, confirming the reversal.
This setup provided a high-confidence buy signal,
showing the importance of understanding candlestick patterns and how they align with market structure.
2. Bearish Engulfing Pattern
Similarly, the bearish engulfing pattern acts as both a reversal and continuation pattern.
There are two ways I use this pattern for high-probability trade setups:
- Reversal Setup: I look for bearish engulfing patterns forming at resistance areas (law: we sell at resistance) within a zone or trendline.
- Continuation Setup: I also use bearish engulfing patterns when the price breaks below support and then retests it. In this scenario, a bearish engulfing pattern at the retest area suggests strong selling pressure and a continuation of the downtrend.
How a Bearish Engulfing Pattern Forms
A bearish engulfing pattern consists of two candlesticks:
- The first candlestick is small and bullish (indicating weak buying pressure).
- The second candlestick is large and bearish, fully engulfing the first one (indicating strong selling momentum).
Example of a Bearish Engulfing Trade setup
In the diagram:
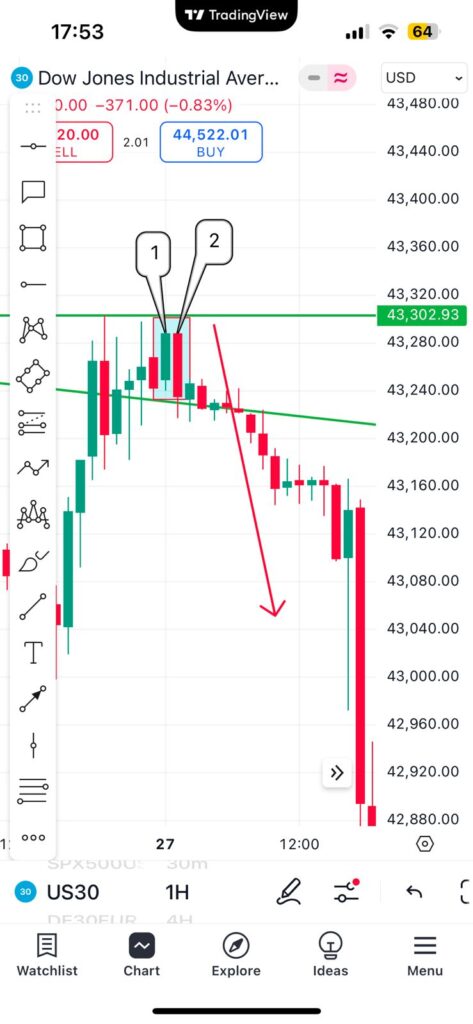
- The market was previously trending upward until the last bullish candlestick formed at a resistance zone and trendline (high-quality signal).
- This was followed by Candlestick 2, a strong bearish candle that fully engulfed the last bullish candlestick.
- This confirmed that selling pressure was taking over, leading to a market drop—a perfect sell opportunity.
3. Morning Star Pattern
A Morning Star pattern is the third pattern I use as an indicator
for high-potential reversal and continuation bullish entries.
It consists of three candlesticks. Similarly, to the bullish engulfing pattern,
I wait patiently for the market to make its way to the support zone or trend.
After the Morning Star pattern has developed, I start buying indices, commodities, currencies, etc.
Now, let’s look into how I capitalize on a continuation scenario.
In a situation where I can identify that bullish momentum is going to break a resistance area,
I patiently wait and allow the market to prove my theory correct.
After it does (the market breaks resistance, turning the zone into new support),
I wait for a retest that can take the form of a Morning Star. Once the pattern has taken shape,
I enter with my high-probability trades.
How a Morning Star Pattern Forms
A Morning Star candlestick pattern consists of three candlesticks:
- The first candlestick is a strong bearish candlestick that closes at the support. This candlestick indicates to technical traders that the market is still heavily dominated by sellers.
- The second candlestick forms right after the first. Its body is much smaller than the first candlestick and can close either bullish or bearish. The key takeaway is that it signals that sellers are losing momentum.
- The third candlestick is a very strong bullish candlestick that is greater than the second candlestick and must cover at least half of the first candle.
Example of a Morning Star Trade Setup
In the diagram:
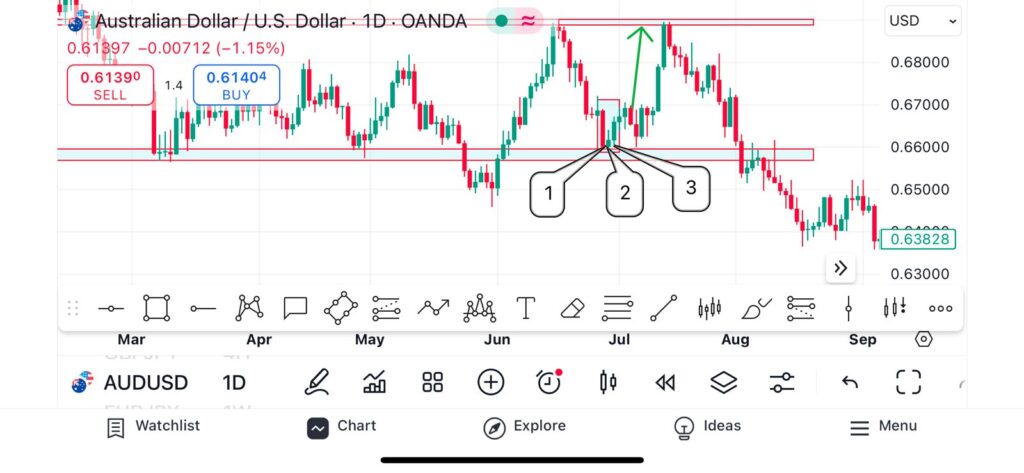
- The market was trading downward until it reached the support level with a strong bearish candlestick (marked 1), indicating that sellers were in control.
- The second candlestick (marked 2) formed as a small bullish candlestick known as a hammer. As seen, this candlestick is much smaller than the first, signalling that sellers are losing momentum.
- The third candlestick (marked 3) formed as a bullish candlestick larger than the second candlestick and covering more than 50% of the first candlestick. This alerts us to strong buying pressure, leading to a potential buy setup.
4. Evening Star Candlestick Pattern
Similarly, to the bearish engulfing pattern,
an Evening Star candlestick pattern can act as a reversal or continuation pattern,
which I also use for sniper entries. Sniper entries are well-timed trades with little to no market drawdown.
Another way to achieve a high trading outcome using this pattern
is when selling pressure breaks through a support area, turning it into new resistance.
When this happens, I patiently wait for the market to retest,
which can take the form of this pattern. When it does, it’s a strong signal to enter sell trades.
How an Evening Star Pattern Forms
An Evening Star candlestick pattern consists of three candlesticks:
- The first candlestick is a strong bullish candle as it approaches resistance, suggesting to a technical trader that buyers are still strong during that period.
- The second candlestick follows after the first and forms a small bearish or bullish candlestick, indicating that buyers are losing momentum.
- The third candlestick is a strong bearish candlestick that is greater than the second candlestick and must cover at least 50% of the first candlestick.
Example of an Evening Star Trade Setup
In the diagram:
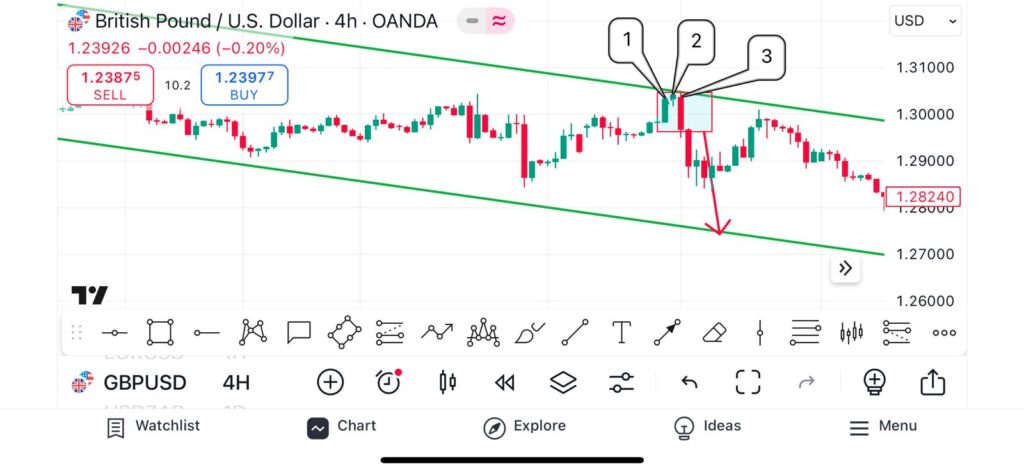
- The first candlestick (marked 1) shows that buyers were in control during that period, and the market momentum was bullish.
- The second candlestick (marked 2) closed as a bearish candlestick, signalling that buyers were losing momentum.
- The third candlestick (marked 3) is a bearish candlestick with its open and close price lower than the second candlestick. Even though the candle’s body did not cover 50% of the first candlestick, its close was below 50%, confirming our Evening Star pattern. This would have been a high-probability setup, leading to a selling opportunity.
By understanding these candlestick patterns
and their formations, traders can make informed decisions and capitalize on high-probability setups in the market.
The Power of Candlestick Signals: Conclusion
As we have discussed, being able to read candlestick patterns helps you make sense of what price is telling you.
If you understand the language, you will be able to uncover its secrets. I have shared with you four powerful candlestick patterns:
Bullish Engulfing, Bearish Engulfing, Morning Star, and Evening Star.
There are many more out there, and you can dedicate time to finding patterns that work best with your strategy.
Developing this skill will allow you to read the market with ease over time. If you made it to this part,
I want to congratulate you—this shows you can start something and finish it. Trading is a personal journey, and traders who

are prepared always come out on top. It is always important to keep growing and learning rather than repeating the same mistakes.
If you want to learn more about other important traits needed to become a profitable trader,
click on this link to get our free FundsandGalore e-book. If you want to learn more about candlesticks, click on this link.