The Only Trading View Indicators You’ll Ever Need

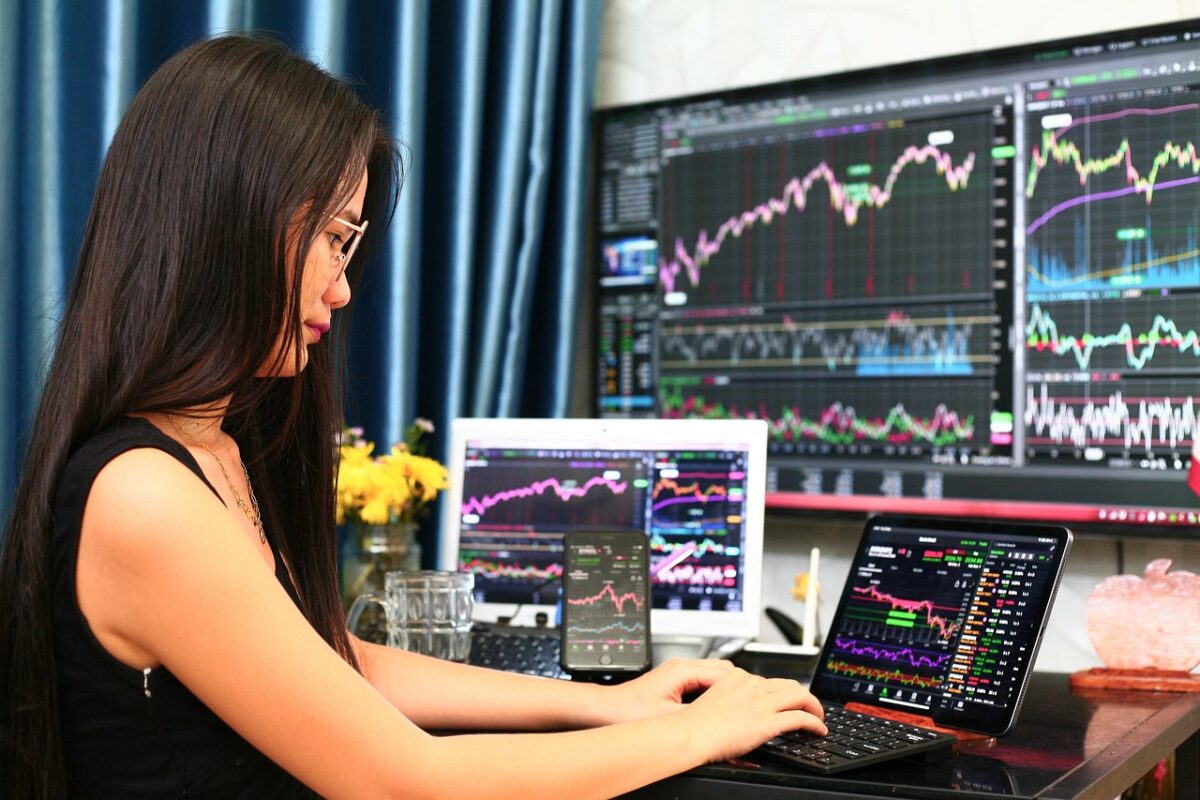
Have you ever felt drained when the market doesn’t follow your price action setups? Or are you looking for guidance as a beginner trader? Well, you’re in luck! Today I’m going to show you the only Trading View indicators you’ll ever need.

These five AI-powered Trading View indicators will help you trade

like a professional and even assist in developing your own trading style.

Eventually, you won’t need them anymore, because by then, you’ll understand how price action works.

The Only Trading View Indicators You’ll Ever Need

The Only Trading View Indicators You’ll Ever Need: Misunderstanding of the Game

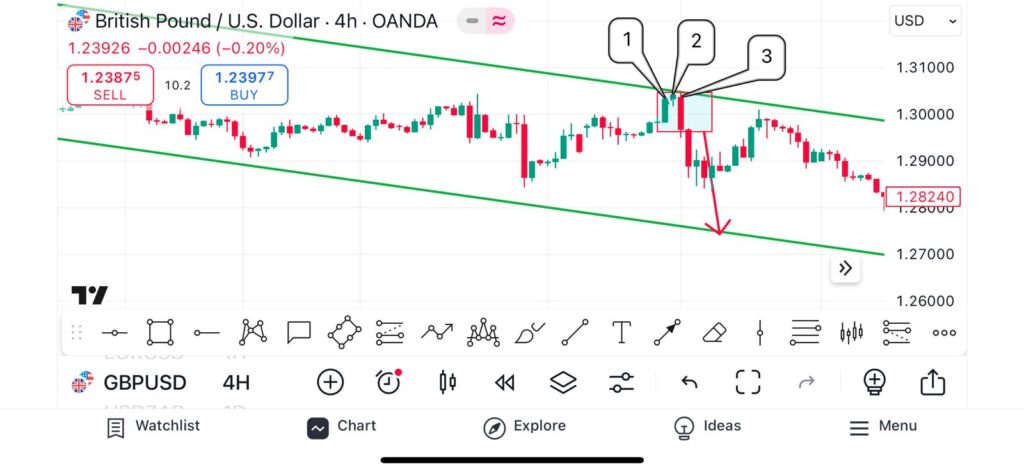
Price action trading or trendline trading is one of the most used trading strategies worldwide.

However, many traders abandon this simple strategy because they claim their setups don’t work.

For example:

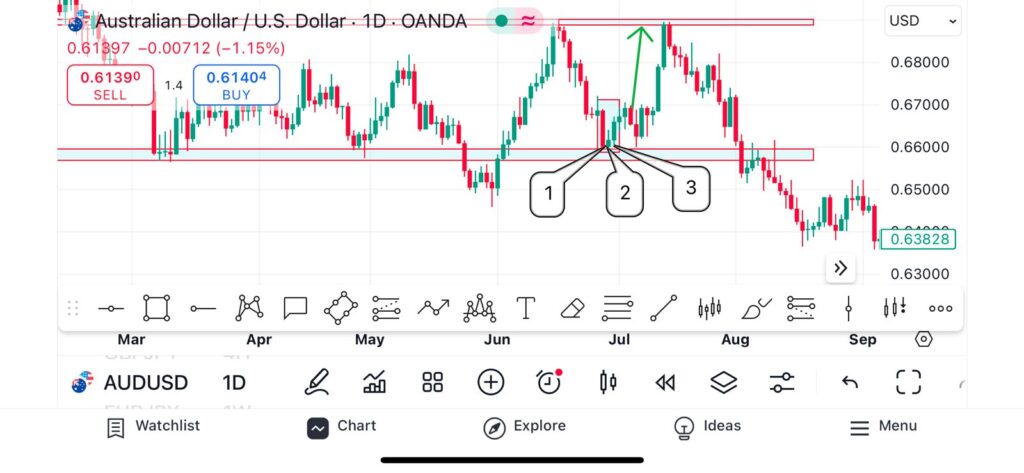
You buy at support, but the market sells. You sell at resistance, but the market buys.

You enter a breakout, and the market reverses.

This leads many traders to underestimate price action and jump from one strategy to another without solving the real issue.

The truth is, 90% of the time, the problem is not the strategy—it’s the lack of skill.

The Only Trading View Indicators You’ll Ever Need

Markets, no matter what you’re trading, include manipulation.

While beginners may feel misled, pro traders see high-probability setups.

It’s not the market that’s flawed; it’s often your inability to properly identify trends, support, resistance, and key levels.

Don’t worry—we’re going to dive into how to learn this faster and with more precision using the right tools.

The Only Trading View Indicators You’ll Ever Need: Importance of Indicators

When I began my trading journey, I tried many tools—even trading robots—but what

truly accelerated my progress were indicators.

Over time, I learned to trade price action without them.

However, indicators can save you months or even years of learning.

This blog is meant to shorten your learning curve without skipping the necessary process.

These indicators support every type of price action trader: scalpers, swing traders, or day traders.

All you need to do is apply them to your style and grow from there.

Remember, knowledge is power, and shortcuts often lead to setbacks.

The Only Trading View Indicators You’ll Ever Need

Let’s explore the only Trading View indicators you’ll ever need that can build an edge for both beginner and advanced traders.
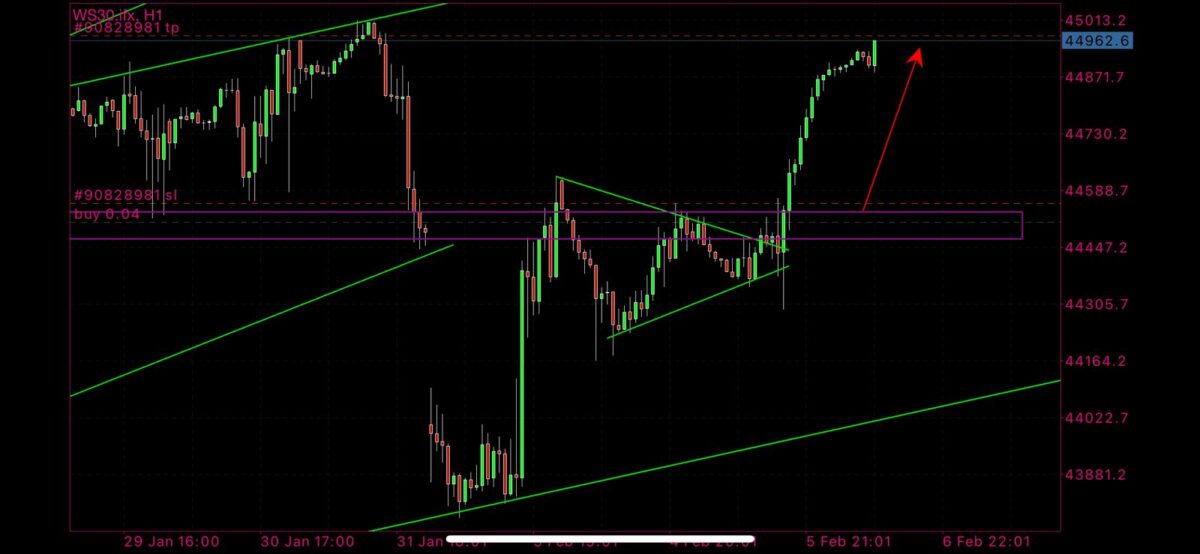
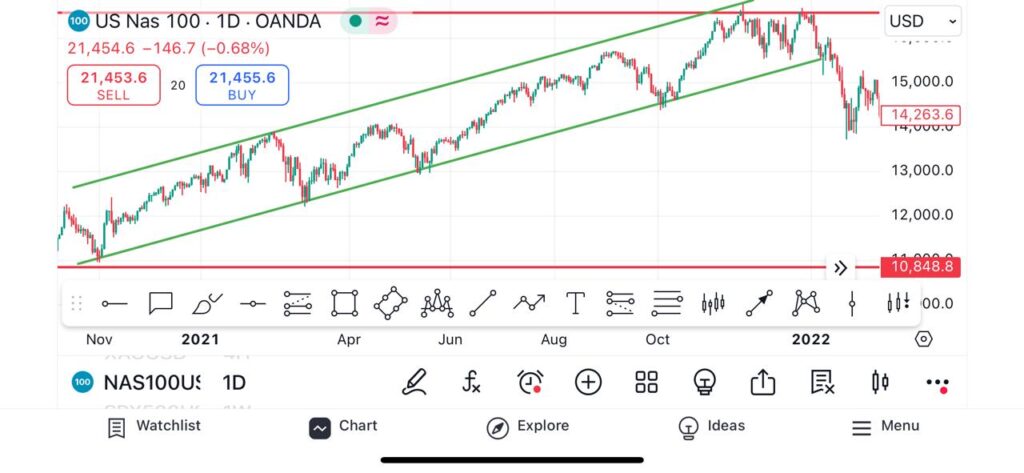
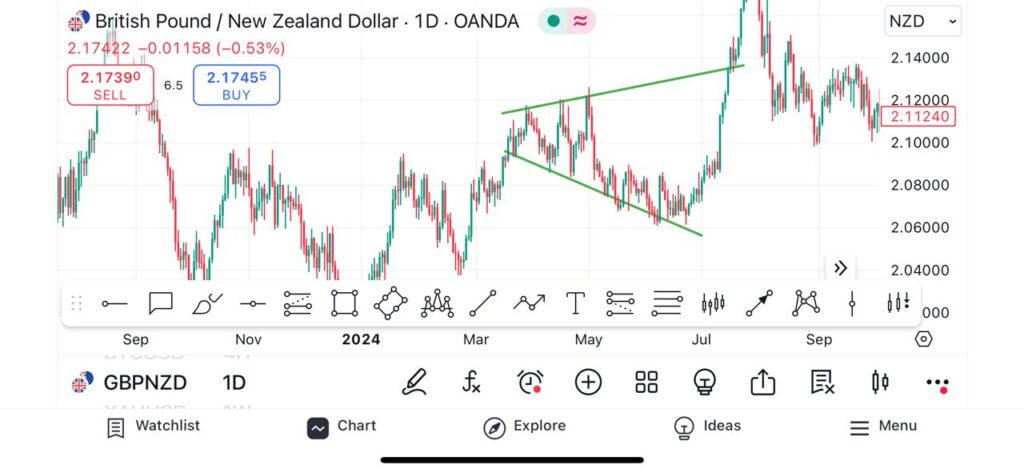
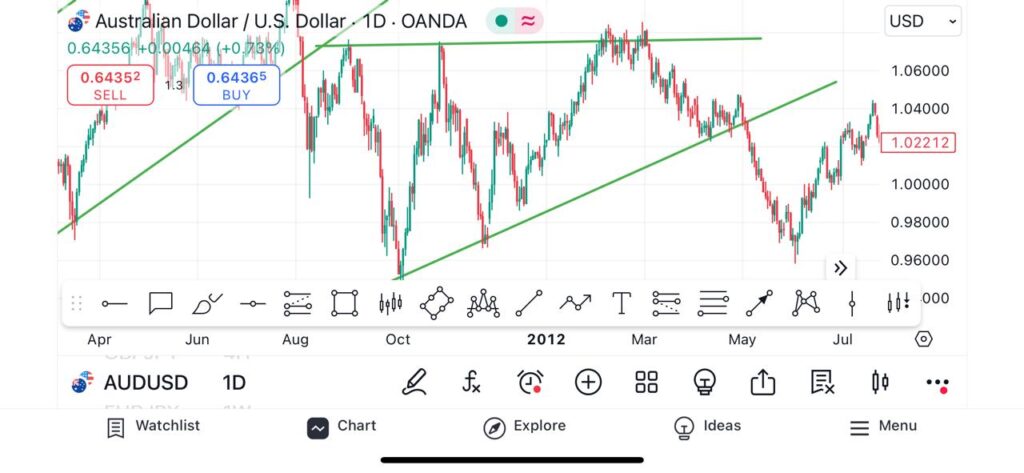
1. Trend Navigator

This indicator helps traders identify market trends.

One common issue with many traders I coach is their inability to draw or adjust trendlines properly.

This stunts their growth because they don’t even realize their mistakes.

The Trend Navigator allows you to compare your analysis with AI-generated trends, helping you

spot where you went wrong and how to improve.

It helps detect bullish and bearish trends and shows you where to exit your positions.

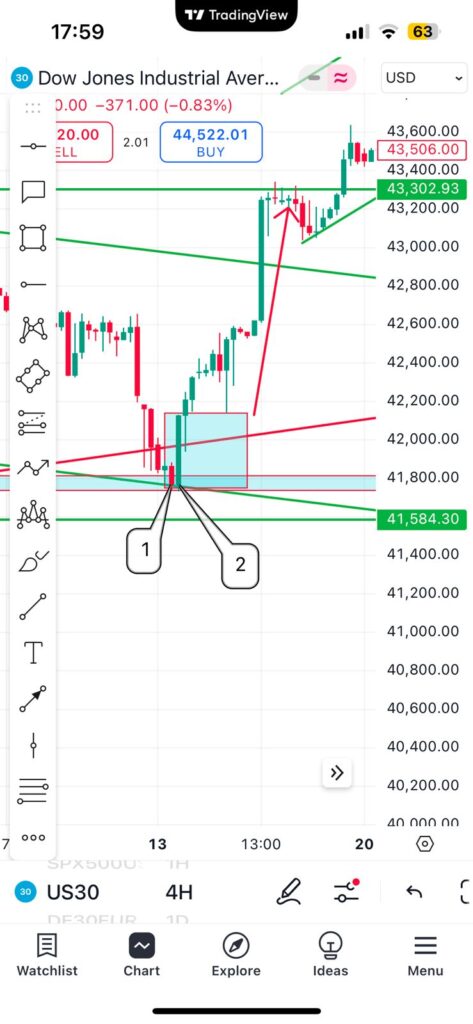
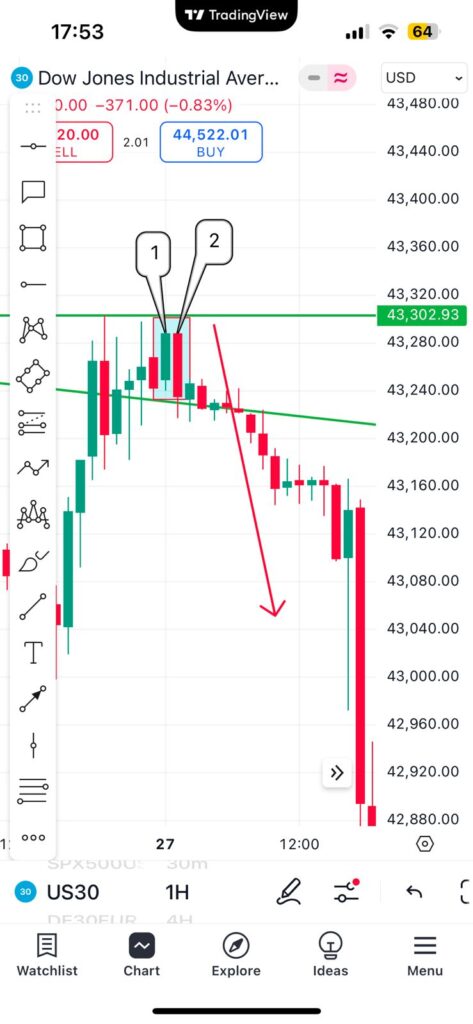
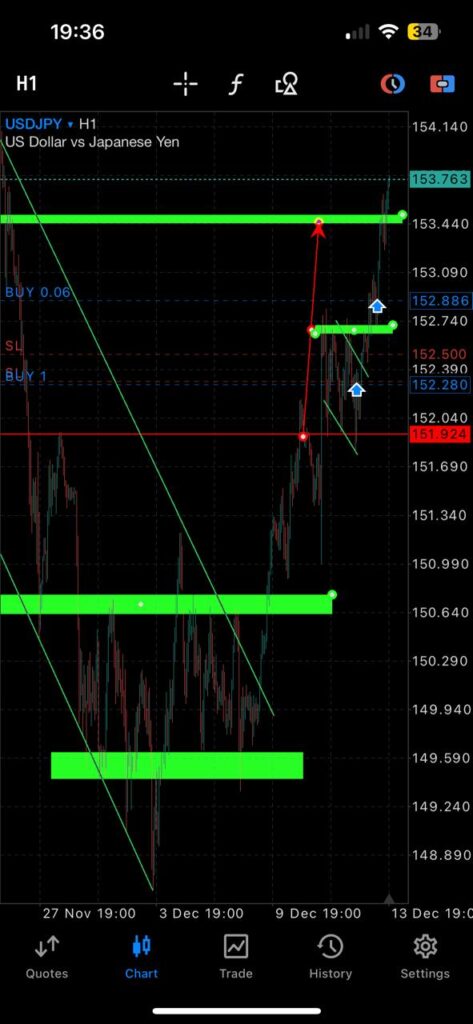
2. Support and Resistance Matrix

This powerful tool identifies demand and supply zones—areas where traders typically buy or sell.

While trendlines alone are not enough, combining them

with support and resistance gives you high-probability trade setups.

These VIP indicators help you understand how to merge key principles to sharpen your trading edge.

3. Market Scanner

The Market Scanner adapts to your trading style.

You can customize it for forex, indices, metals, or any market you prefer.

As Warren Buffett advises: “Only invest in what you understand.”

The same applies to trading. Focus on what you know.

Once you identify your preferred pairs or instruments, this tool allows you to set alerts—such as

when a bullish engulfing pattern forms, RSI drops below 30, or price moves above the 200 MA.

It simplifies your trading process by automatically meeting your entry conditions.

It’s suitable for both day and swing traders.

4. Oscillator

Being able to identify overbought or oversold conditions is essential in price action.

I often highlight this in my market breakdowns on YouTube.

Oscillators help identify reversal zones:

-When overbought → look for sell opportunities.

-When oversold → look for buy opportunities.

-The most common oscillators include:

Relative Strength Index (RSI): Measures price momentum. Above 70 = overbought; below 30 = oversold.

MACD (Moving Average Convergence Divergence): Measures trend momentum across timeframes.

It was my favourite tool when learning about momentum.

The Shortcut Smart Traders Use to Master Price Action

If you’ve made it this far—congratulations!

You now understand why traders struggle with trends, support, resistance, and entries.

But what if you could master all this quicker, without gambling or spending all day on charts?

The Only Trading View Indicators You’ll Ever Need

Get 24/7 Access to 5+ Powerful VIP Trading Indicators

These VIP Trading View indicators are ideal for price action or trendline traders ready to level up their game.

They offer clarity, precision, and live signal alerts.

Not only will you receive live alerts, but you’ll also learn to spot trends, key levels, and momentum independently—on any timeframe.

What You’ll Unlock

With these tools, you’ll gain:

  • 24/7 access to all five indicators.
  • The ability to distinguish high-probability from low-probability trades.
  • Compatibility with any market: forex, indices, oil, stocks, metals, etc.
  • Usage across all devices—PCs, smartphones—and from any country.
  • 24/7 support.

If you’re serious about mastering price action and fast-tracking your education, this is the edge you need.
[Click here to get 24/7 access to VIP TradingView Indicators now.]

The Only Trading View Indicators You’ll Ever Need: Conclusion

Mastering price action takes time, but the right tools can dramatically shorten the learning curve.

These five essential Trading View indicators are all you need

to identify trends, find support/resistance zones, scan the market, and pinpoint overbought/oversold areas.

They’re especially valuable for beginners or traders seeking more consistency.

If you’re serious about developing a winning edge and understanding market structure with precision, these indicators

are the best shortcut you can take—without sacrificing quality learning

Forex Scams in South Africa: Unmasking the Deception

Forex scams in South Africa have made thousands—if not millions—of rands for scammers who understand the power of illusion to lure their victims.

As Friedrich Nietzsche once said, “Sometimes people don’t want to hear the truth because they don’t want their illusions destroyed.”

The Rise of Forex Trading and Scams in South Africa

Forex trading is a growing industry in the South African market, especially after the COVID-19 pandemic.

During this time, many students lacked access and resources to continue their studies.

Employees were retrenched, and many individuals struggled to find employment.

forex scams in south africa

As a result, people began spending more time on social media, and alongside

this surge, many forex scammers emerged, seemingly out of nowhere.

These scammers used the same blueprint to dominate the space—a blueprint we’ll explore shortly.

One major reason many people got into trading was the flashy lifestyle marketed by supposed forex traders online.

I, too, was lured in this way. However, my personal interest in forex

stemmed from a desire to earn a decent living without relying on job security.

Even though I performed well academically and studied B-Com in Business Studies

at Eduvos Potchefstroom, I never liked being told what to do.

I always preferred doing things my own way, which helped me excel in school—despite not enjoying the structure.

The lavish lifestyle displayed before me fuelled my curiosity, and I dedicated everything

to understanding what forex really is and how people actually make money from it.

Unfortunately, many beginner traders do not take the time to do their due diligence.

They see the lifestyle and fall for money-making schemes, which often leads them to become victims of scammers.

How Forex Scammers in South Africa Target Their Victims

Let’s break down the methods scammers use to target individuals in South Africa.

What stood out to me is their deep understanding of human psychology—the same kind used by politicians worldwide.

To manipulate people, you must first understand what they desire most.

Then, you play on those emotions, lower their guard, and go in for the kill.

Scammers often target those who desperately desire wealth but have no clear path to achieving it

. With bold marketing tactics and promises of a better life, people are enticed

to invest their savings, pension funds, or tuition money—all with the hope of multiplying it tenfold.

forex scams in south africa

In the end, scammers walk away with millions, and the victims are left worse off than before.

Fake Investment Schemes

One of the most common tools used by forex scammers is fake investment schemes.

These schemes vary, but the most popular ones promise unusually high returns—7% to 10% weekly, or even 100% in one week.

For someone new to forex, that kind of return

sparks dreams: “I’ll build my mother a house, marry my girlfriend, buy a new car…”

In the middle of these dreams, they lose their guard, make the investment—and never hear from the scammer again.

Meanwhile, that scammer is posting daily content of expensive bottles, cars, and parties—all funded by your hard-earned money.

It’s not a coincidence—it’s intentional.

Unregulated Brokers

Unregulated brokers take the deception even further.

These brokers target traders—especially beginners—with promises of massive gains and user-friendly platforms.

They understand how regulations work and use loopholes to their advantage.

forex scams in south africa

By registering in countries with weak oversight—like Belize or Seychelles—they avoid

the scrutiny of South Africa’s FSCA, which has no legal authority over foreign entities.

These brokers also partner with social media influencers (often scammers themselves) to appear trustworthy.

They run polished websites and invest heavily in ads to gain your trust.

The trick is simple: it’s easy to deposit money—but incredibly difficult to withdraw it.

I’ve experienced it first-hand. I made profits, tried to withdraw, and suddenly my account was frozen.

There was nothing I could do. That’s why verifying

a broker’s legitimacy is crucial before signing up or making any deposits.

Today, I only trade with regulated brokers that give me no issues and process my withdrawals promptly.

Signal Seller Scams

Signal services are another profitable scam.

There’s a well-known scammer in South Africa selling signal access for R500 a month

to over 2,000 people. That’s R1 million monthly, just from signals!

These so-called “mentors” use the money to rent luxury cars and live lavishly, while

the people under their mentorship consistently lose money.

Meanwhile, the scammers post fake profits on social media.

It’s not accidental—it’s all part of the deception.

Social Media Fraudsters

Like I mentioned earlier, South African forex scammers follow the same blueprint:

flashy cars, expensive houses, daily profits.

Why? Because it works.

But behind all the glitz lies manipulation.

One person I truly admire is Rydall Flicks.

He exposes fake traders who exploit people with real, concrete evidence.

Check out his YouTube channel—he doesn’t just talk; he proves.

The need to constantly show off on social media often reflects a lack of true success.

Real success doesn’t require external validation—it speaks through consistent results and value.

Forex Scams in South Africa: Real Forex Traders

Real forex traders don’t need to showcase Lamborghinis or pop champagne bottles.

They offer genuine value.

They mentor those who are truly passionate about learning the game—not people looking for shortcuts.

forex mentorship

They understand that forex is not a get-rich-quick scheme.

Just like becoming a doctor takes years of study and effort, becoming a

successful trader takes time and dedication.

A teacher and a doctor may both be valuable, but the time and skill required

to become a doctor explain the difference in income.

Similarly, successful trading requires patience, discipline, and years of practice.

Genuine traders showcase their trades, not their lifestyle.

Don’t fall for illusions—value knowledge, and you’ll be able to build a life of real abundance.

Forex Scams in South Africa: Conclusion

Forex trading is a legitimate and potentially profitable

venture, but the industry in South Africa is riddled with deception.

From fake investment schemes and signal seller scams to unregulated brokers

and social media fraudsters—scammers use every trick in the book to prey on the uninformed.

If you want to succeed in forex, focus on education, not illusions.

Avoid shortcuts, question bold promises, and always verify a broker’s regulation status.

The key to financial freedom in trading is not found

in flashy lifestyles or overnight success—it’s in the slow, steady pursuit of real knowledge.

Stay vigilant, do your due diligence, and never stop learning.

That’s how you unmask deception and take control of your trading journey.

Student Life & Forex: How to Win Both Without Burning Out

Finding Balance Between Student Life & Forex

Student Life & Forex: How to Win Both Without Burning Out.

A common question I get from students—whether in high school or

university—is whether they should drop out to focus on their forex journey.

My response is always the same: it’s up to you.

That decision isn’t mine to make.

The problem is, a lot of so-called forex “gurus” encourage people to drop out of school to pursue forex full-time.

This is false and misleading advice.

Forex is just like any subject or module you study in school or university—not everyone will find success in it.

Not because they’re stupid or lack potential, but because forex requires determination and the right mind-set.

If you fail at self-mastery, constantly seek external validation, or can’t handle losses during the learning process,

you’ll struggle to succeed in this industry.

Now, imagine dropping out only to discover forex isn’t what you thought it would be—then what?

That’s why I’ve created this guide to help you balance both worlds. That way,

if forex doesn’t work out, you still have your education,

which you can later use to find a more suitable path.

Why Finding a Rhythm Between the Two Worlds Is Important?

Finding a rhythm between student life and forex takes discipline.

Without balance, one area will suffer—or both.

The goal is to excel in both worlds. By achieving balance, you can potentially scale

your finances much quicker, helping you reach a comfortable lifestyle sooner.

Student Life & Forex

Remember: each world complements the other.

That’s what you want to master with this post.

So let’s dive into how you can manage both without burning out.

Student Life & Forex: Time Management Plan

This is the most important phase. First, map out your personal timetable.

Start by writing or typing your schedule for your studies.

Identify when your classes start and end, and highlight your compulsory sessions.

Tools like Google Calendar or Notion can help you keep track.

By doing this, you’ll know exactly when you’re free

to check the markets—such as during breaks or after class.

Everything must be clearly laid out in your timetable.

Time Management: Phase Two

Now, let’s add forex into the equation.

First, we’ll focus on beginner traders,

then on those who already understand the basics and are refining their strategy.

If you’re a beginner, your plan should differ from someone who’s currently testing or refining a strategy.

During class breaks, focus on your studies. Complete your homework or assignments after school.

Student Life & Forex

Once done, take a break, then dive into forex education.

Spend a minimum of 30 minutes to 2 hours daily learning the basics—forex terminology,

candlestick patterns, charts, etc. Learn gradually and reflect on what you’ve absorbed.

Don’t overwhelm yourself. Forex is a long-term game.

If you’re a student who already understands the basics and has a strategy,

you can use class breaks to check if the market is ready for entries.

Prioritize the London and New York sessions for better liquidity and trading opportunities.

If a setup might play out during class, place pending orders with take profit and stop loss levels,

so you don’t miss the move and can stay focused on your studies.

After class, reflect on your trades—wins, losses, and areas of improvement.

Spend 30 minutes to 2 hours refining your strategy once your schoolwork is done.

Set Clear Goals

Setting clear goals for both your studies and forex is essential.

Over time, you’ll be able to assess your progress and make adjustments.

Move with purpose. In forex, key goals include avoiding overtrading and focusing only on quality setups.

Student Life & Forex: Avoid Emotional Trading

Student life can be overwhelming, and that emotional pressure can negatively impact your trading psychology.

This might lead to over-leveraging or overtrading, possibly resulting in a blown account.

Over-leveraging & overtrading

Be self-aware. If you’ve had a bad day, it’s best to stay away from the charts for 7 to 24 hours

until your emotions stabilize. Avoid emotional trading at all costs.

Minimize Screen Time with a Trading Plan

Discipline plays a major role here. Since you’re balancing both studies and trading,

the time you’d usually spend watching movies will now be used for learning forex.

This is where many students fall short.

Ask yourself: will watching movies bring you financial freedom? Or is it just wasting your time?

I’m not here to dictate your choices—but I am here to challenge your thinking.

To master both student life and forex, sacrifices are required.

That means going out less, embracing solitude, and focusing on your craft.

While others party, you study—and when others work, you’ll enjoy the fruits of your labour.

The choice is yours.

Prioritize Health and Rest

Finally, it’s crucial to prioritize your health and get proper rest to avoid burnout.

Your brain needs adequate sleep to function at full capacity. Lack of rest can impair decision-making.

mental health in forex

Using these strategies will help you stay balanced, consistent, and disciplined.

Challenges aren’t setbacks—they’re opportunities to grow, learn, and become a master

of multitasking in today’s fast-paced world.

You define who you are. While others quit, Funds and Galore thrives through both the highs and lows.

Conclusion: How to Win at Both Without Burning Out

Balancing student life and forex trading is possible—but it requires discipline, self-awareness, and smart planning.

By managing your time wisely, setting clear goals, avoiding emotional trading, and prioritizing rest, you can

grow in both areas without sacrificing one for the other.

Success doesn’t come from rushing—it comes from consistency.

Build both your academic and trading foundation step by step.

That way, no matter which path proves more fruitful, you’ll always have the upper hand.

The Power of Candlestick Signals

The power of candlestick signals in the markets can be traced back to the 16th century.

Candlesticks were used back then, just as they are today,

by technical traders and analysts to read market behaviour,

which is heavily influenced by supply and demand, as well as emotions like greed and fear.

We will first take a brief dive into the history of candlesticks, and then

I’ll show you four powerful candlestick signals that still work today—signals I personally use to identify high-probability bullish or bearish entries.

History of Candlesticks: The Power of Candlestick Signals

In the 18th century, a legendary Japanese rice trader named Munehisa Homma developed the Japanese candlestick method to track price movements.

The Power of Candlestick Signals

It is important to note that during this time, the rice market dominated the financial markets.

Rice was so significant that it played a major role in Japan’s economy.

Munehisa Homma’s early work on candlestick charting, which incorporated

human emotions such as greed and fear, market behaviour, and even weather conditions, dates back to the mid-17th century during the Edo period.

The Power of Candlestick Signals Invented by Homma

It is important to note that the candlestick patterns created by Munehisa Homma continue to help technical traders today by providing a visual representation of the market.

These patterns offer signals that help traders determine areas of high or low bullish and bearish activity, as well as potential reversals or continuation zones.

Historical records indicate that Homma developed these candlestick patterns based on his Sakata Rules.

Some of the candlestick patterns he introduced might sound familiar, such as the Doji, Hammer, Engulfing, and Spinning Tops, among others.

If these patterns are new to you, don’t worry—I’ll be covering a few of them that I personally use to gain an edge in the market.

The Power of Candlestick Signals: 4 Powerful Candlestick Patterns

Now, we dive into four powerful candlestick patterns that I use to achieve highly accurate price predictions in the market, allowing me to yield rewarding long-term returns.

But before we do that, let’s define what a candlestick is and what it consists of.

By understanding the anatomy and psychology of candlesticks,

it’s like visiting a foreign country and being able to communicate in its language.

The Power of Candlestick Signals

Having this ability allows you to navigate that country with ease,

unlike relying on time-consuming methods to find your way around.

The same applies to technical trading—when you understand the language spoken by candlesticks,

you can navigate price movements with greater confidence and accuracy.

The Power of Candlestick Signals

What is a Candlestick?

A candlestick, as I mentioned earlier, is a visual representation of price movement,

available across different timeframes (4-hour, 1-hour, 30-minute, etc.).

Candlesticks provide valuable information, including the opening price,

closing price, highest price, and lowest price over a specific period.

For those unfamiliar with candlestick structures, I will provide a video link later in this blog to illustrate how they appear.

I use candlesticks in combination with trends, key levels, and support and resistance zones.

You will see exactly how this works when I discuss pattern formations for entries.

Another key aspect to pay attention to is the colour scheme of the candlestick.

When the bulls (buyers) are in control, the candlestick typically appears white or green.

When the bears (sellers) are in control, the candlestick is usually black or red.

Personally, I use the green/red colour scheme, but the colours can be customized to your preference—it doesn’t really affect the analysis.

Benefits of Using Candlesticks Over Other Chart Types

One major advantage of using candlesticks instead of other chart types,

such as line charts or bar charts, is their compatibility with trendline strategies and support or resistance zones.

A technical trader who understands candlestick patterns can capitalize on market reversals,

such as bullish engulfing patterns forming at a support zone.

These patterns provide strong buying signals, indicating that sellers

have exhausted their momentum and that strong buying pressure is about to take over.

As you will see, my ability to read candlestick patterns gives me an edge in uncovering hidden market signals.

Take note: If you lack the ability to read candlesticks, it will be much harder to spot these signals and make informed trading decisions.

The Power of Candlestick Signals: 4 Powerful Candlestick Patterns

Now, let’s explore four candlestick patterns that I use to anticipate future price movements.

By understanding these patterns, you will be able to spot high-probability

reversal entries and continuation-based buying and selling opportunities.

Bullish Engulfing Pattern

The bullish engulfing pattern is one of my favourite candlestick patterns for capitalizing on strong bullish momentum.

There are two key ways I use this pattern for high-probability trade setups:

  • Reversal Setup: I look for bullish engulfing patterns forming at support areas (law: we buy at support) within a zone or trendline.
  • Since bullish engulfing patterns act as reversal signals, their presence at key support levels increases the probability of a successful trade.
  • Continuation Setup: I also use bullish engulfing patterns when looking for market continuations. For example, when price breaks above resistance, a break-and-retest scenario may turn previous resistance into new support. If a bullish engulfing pattern forms at this retest area, it signals strong buying activity and a potential continuation of the uptrend.

How a Bullish Engulfing Pattern Forms

A bullish engulfing pattern consists of two candlesticks:

  • The first candlestick is small and bearish (indicating weak selling pressure).
  • The second candlestick is large and bullish, fully engulfing the first one (indicating strong buying momentum).

Example of a Bullish Engulfing Trade setup

In the diagram of my trading setup:

bullish engulfing pattern
  • Candlestick 1 was a bearish candle that touched the support zone and support trendline.
  • Shortly after, Candlestick 2 fully engulfed Candlestick 1 with a strong bullish candle, confirming the reversal.

This setup provided a high-confidence buy signal,

showing the importance of understanding candlestick patterns and how they align with market structure.

2. Bearish Engulfing Pattern

Similarly, the bearish engulfing pattern acts as both a reversal and continuation pattern.

There are two ways I use this pattern for high-probability trade setups:

  • Reversal Setup: I look for bearish engulfing patterns forming at resistance areas (law: we sell at resistance) within a zone or trendline.
  • Continuation Setup: I also use bearish engulfing patterns when the price breaks below support and then retests it. In this scenario, a bearish engulfing pattern at the retest area suggests strong selling pressure and a continuation of the downtrend.

How a Bearish Engulfing Pattern Forms

A bearish engulfing pattern consists of two candlesticks:

  • The first candlestick is small and bullish (indicating weak buying pressure).
  • The second candlestick is large and bearish, fully engulfing the first one (indicating strong selling momentum).

Example of a Bearish Engulfing Trade setup

In the diagram:

bearish candlestick
  • The market was previously trending upward until the last bullish candlestick formed at a resistance zone and trendline (high-quality signal).
  • This was followed by Candlestick 2, a strong bearish candle that fully engulfed the last bullish candlestick.
  • This confirmed that selling pressure was taking over, leading to a market drop—a perfect sell opportunity.

3. Morning Star Pattern

A Morning Star pattern is the third pattern I use as an indicator

for high-potential reversal and continuation bullish entries.

It consists of three candlesticks. Similarly, to the bullish engulfing pattern,

I wait patiently for the market to make its way to the support zone or trend.

After the Morning Star pattern has developed, I start buying indices, commodities, currencies, etc.

Now, let’s look into how I capitalize on a continuation scenario.

In a situation where I can identify that bullish momentum is going to break a resistance area,

I patiently wait and allow the market to prove my theory correct.

After it does (the market breaks resistance, turning the zone into new support),

I wait for a retest that can take the form of a Morning Star. Once the pattern has taken shape,

I enter with my high-probability trades.

How a Morning Star Pattern Forms

A Morning Star candlestick pattern consists of three candlesticks:

  • The first candlestick is a strong bearish candlestick that closes at the support. This candlestick indicates to technical traders that the market is still heavily dominated by sellers.
  • The second candlestick forms right after the first. Its body is much smaller than the first candlestick and can close either bullish or bearish. The key takeaway is that it signals that sellers are losing momentum.
  • The third candlestick is a very strong bullish candlestick that is greater than the second candlestick and must cover at least half of the first candle.

Example of a Morning Star Trade Setup

In the diagram:

morning star pattern
  • The market was trading downward until it reached the support level with a strong bearish candlestick (marked 1), indicating that sellers were in control.
  • The second candlestick (marked 2) formed as a small bullish candlestick known as a hammer. As seen, this candlestick is much smaller than the first, signalling that sellers are losing momentum.
  • The third candlestick (marked 3) formed as a bullish candlestick larger than the second candlestick and covering more than 50% of the first candlestick. This alerts us to strong buying pressure, leading to a potential buy setup.

4. Evening Star Candlestick Pattern

Similarly, to the bearish engulfing pattern,

an Evening Star candlestick pattern can act as a reversal or continuation pattern,

which I also use for sniper entries. Sniper entries are well-timed trades with little to no market drawdown.

Another way to achieve a high trading outcome using this pattern

is when selling pressure breaks through a support area, turning it into new resistance.

When this happens, I patiently wait for the market to retest,

which can take the form of this pattern. When it does, it’s a strong signal to enter sell trades.

How an Evening Star Pattern Forms

An Evening Star candlestick pattern consists of three candlesticks:

  • The first candlestick is a strong bullish candle as it approaches resistance, suggesting to a technical trader that buyers are still strong during that period.
  • The second candlestick follows after the first and forms a small bearish or bullish candlestick, indicating that buyers are losing momentum.
  • The third candlestick is a strong bearish candlestick that is greater than the second candlestick and must cover at least 50% of the first candlestick.

Example of an Evening Star Trade Setup

In the diagram:

The Power of Candlestick Signals
  • The first candlestick (marked 1) shows that buyers were in control during that period, and the market momentum was bullish.
  • The second candlestick (marked 2) closed as a bearish candlestick, signalling that buyers were losing momentum.
  • The third candlestick (marked 3) is a bearish candlestick with its open and close price lower than the second candlestick. Even though the candle’s body did not cover 50% of the first candlestick, its close was below 50%, confirming our Evening Star pattern. This would have been a high-probability setup, leading to a selling opportunity.

By understanding these candlestick patterns

and their formations, traders can make informed decisions and capitalize on high-probability setups in the market.

The Power of Candlestick Signals: Conclusion

As we have discussed, being able to read candlestick patterns helps you make sense of what price is telling you.

If you understand the language, you will be able to uncover its secrets. I have shared with you four powerful candlestick patterns:

Bullish Engulfing, Bearish Engulfing, Morning Star, and Evening Star.

There are many more out there, and you can dedicate time to finding patterns that work best with your strategy.

Developing this skill will allow you to read the market with ease over time. If you made it to this part,

I want to congratulate you—this shows you can start something and finish it. Trading is a personal journey, and traders who

The Power of Candlestick Signals

are prepared always come out on top. It is always important to keep growing and learning rather than repeating the same mistakes.

If you want to learn more about other important traits needed to become a profitable trader,

click on this link to get our free FundsandGalore e-book. If you want to learn more about candlesticks, click on this link.

Strategic Risk Approaches in Trading

To master strategic risk approaches in trading, one must possess strong technical analysis skills.

Numerous technical trading strategies exist, but today’s piece focuses

on how to excel in trends and support and resistance zones because that’s how I personally trade.

There are various ways to apply risk management to gain an edge over the market.

What I am about to share works, and these strategies have been thoroughly tested.

Strategic Risk Approaches to Have an Edge

Mastering these three strategic risk approaches in trading will allow you to gain an edge over the market.

Strategic Risk Approaches in Trading

This skill set will enable you to navigate market manipulations effortlessly.

I have previously discussed who is responsible for market manipulations and how to protect yourself as a retail trader.

Today, I will dive deeper into three strategies and provide

a blueprint that you can apply alongside your technical ability.

Take note: if you have good risk management but lack technical skills, your trading business will collapse.

Similarly, if you have strong technical skills but lack risk management, your business will also fail.

Think of trading as a business that you run alone.

To gain an edge over the market, you need to find harmony between your technical skills and strategic risk approaches.

Strategic Risk Approaches in Trading: Using Stop Losses

This approach is crucial because it helps protect your investments.

You should internalize this formula or write it down and place it somewhere visible at your trading station:

Formula: Stop Loss = Edge over the Market

The S=D approach is a recommended starting point, suitable for traders with varying levels of access to capital.

Once your overall strategy is aligned and all components work in harmony, capital investment becomes your next focus.

Remember, we all come from different financial backgrounds,

so use your situation to your advantage.

Do not compare yourself or attempt to fully replicate someone else’s capital investment strategy.

Example 1: Mrs. Daenerys

Mrs. Daenerys saved R10,000 ($546) to invest in the forex market.

After spotting a setup, she quickly entered buy positions.

As prices rose above her entry point, she felt confident and left for work, assuming prices would remain stable.

Strategic Risk Approaches in Trading

Unfortunately, she did not place a stop loss.

Five hours later, during her lunch break, she checked the market and was shocked to see a drastic

price drop, reducing her account from R10,000 to R2,000 ($109).

She closed the trade, wondering what went wrong.

Example 2: Mrs. Reeves

Mrs. Reeves, on the other hand, saved R5,000 ($273) for forex trading.

After identifying an opportunity, she entered buy positions but ensured she placed a stop loss.

Like Mrs. Daenerys, the market dropped drastically, but her stop loss

limited her loss to 5% of her account, amounting to R250 ($14).

The strategic use of stop losses protected Mrs. Reeves from significant losses, ensuring her trading account remained healthy.

Conversely, Mrs. Daenerys’ failure to use a stop loss left her account severely depleted.

Strategic Risk Approaches in Trading: Risk/Reward Ratio

The second approach involves managing your risk/reward ratio. The formula for this is:

Formula: Target – Risk Exposure = Edge over the Market

A balanced risk/reward ratio ensures you win big and lose small, regardless of market conditions.

Strategic Risk Approaches in Trading

By exposing only 1-5% of your account and potentially gaining 10-15%, this approach

allows you to trade with discipline, ensuring long-term survival and profits.

It also helps curb fear and greed by clearly defining acceptable risk and potential gains.

Example 1: Nelson

Nelson reviewed his trading history, wondering why his account remained negative despite winning and losing trades.

Upon analysis, he discovered that his average profit per trade was $14, while his average loss was $30.

This imbalance revealed issues with fear—exiting trades too early in profits—and greed—holding trades too long, leading to losses.

Example 2: Adolph

Adolph’s trading history showed consistent growth.

He realized that, on average, he lost $40 per trade but gained $150 on winning trades.

With eight losses and four wins, he remained profitable due to his disciplined approach to managing risk and reward.

This demonstrates the importance of adhering to a favourable risk/reward ratio, especially

for growing small accounts into significant balances over time.

Strategic Risk Approaches in Trading: Overleveraging

In my previous article, “Protect Your Trades from Manipulations,” I highlighted the dangers of overleveraging.

Overleveraging can lead to significant losses, potentially

wiping out your trading account with a single trade.

However, there is a way to use overleveraging strategically without exposing yourself to excessive risk.

This approach involves amplifying gains while minimizing losses by not funding your entire trading account upfront.

Example: Mpumi_n_co

Mpumi_n_co saved R10,000 ($546) for trading.

Normally, he risks 5% of his capital, or R500 ($27), per trade, aiming for a 15% return (R1,500 or $82).

This time, he employs a strategic overleveraging approach.

overleveraging strategy

Instead of funding the entire R10,000, he funds only R500.

He places more positions than usual and allows the trade to play out.

If he loses, he only loses R500, leaving him with R9,500.

However, when he wins, he gains an average of R2,000 to R3,000.

This strategy enables Mpumi_n_co to amplify gains

while maintaining effective risk management, even without placing an actual stop loss.

However, this method requires mastery of timing market entries and exits before attempting.

Strategic Risk Approaches in Trading: Conclusion

Strategic risk management is essential for trading success.

Using stop losses, maintaining a disciplined risk/reward ratio, and strategically

overleveraging are proven methods to protect and grow your trading account.

Mastering these approaches requires practice, discipline, and a thorough understanding of market behaviour.

By integrating these strategies into your trading routine, you can gain a significant

edge over the market while minimizing risks and maximizing returns.

Protect Your Trades from Manipulations

My goal with today’s piece is to teach you how to protect your trades from manipulations.

To fully master this pure technical skill, one first needs to understand why

market manipulation occurs and who is responsible for its occurrence.

Since I’m a pure technical trader who does not use news or any other form of indicators,

I’ll teach you how traders like me navigate through this deception, which is designed to target retail traders.

Protect Your Trades from Manipulations: Overall Market Direction

On my YouTube channel, I always emphasize the importance of trading with the overall market direction.

Protect Your Trades from Manipulations

The reason why most traders don’t adhere to this principle is their desire to trade every day (a lack of patience).

This is exactly what market manipulators want,

as they use it to take money from retail traders and into the pockets of the elites.

The Oracle of Omaha, Warren Buffett, is often paraphrased as saying, “The stock market is a device for transferring money from the impatient to the patient.”

I uploaded content on my YouTube channel titled How to Triple Your Initial Investment,

where I showcased all the trades I placed throughout 2024, trading only the Nasdaq100 and S&P500.

How I Avoided Unnecessary Manipulation

At the beginning of the year, I identified that the overall market

was in an all-time bullish trend by using the daily timeframe.

The daily timeframe allows me to identify the overall market momentum.

Protect Your Trades from Manipulations

I focused solely on buying opportunities and ignored all selling opportunities throughout the year,

thereby trading with the market’s direction.

Trading against the market is like trying to swim against a strong current.

As I mentioned in my previous piece on how market manipulation targets retail traders,”

manipulators have enough liquidity to move the markets. So why trade against them? Instead, you should trade with them.

Protect Your Trades from Manipulations: News Releases

News releases can be influenced by manipulators to drive activity in the markets.

They know a lot of retail traders will be looking for buying or selling opportunities to capitalize on market spikes or volatility.

How Manipulators Use News Events

News Events

This is when manipulators inject money to trap impatient traders. For example, John Lannister enters a buy order

at the support level because Non-Farm Payrolls (NFP) news has been released, and he sees volatile bullish candlesticks emerging.

Seconds after John and many retail traders enter, market manipulators place large sell orders,

driving the price of the stock/currency down below the support area (creating large bearish candlesticks).

This triggers John’s stop loss, along with many other traders’ stop losses.

With frustration, John tries to capitalize on the selling opportunities

since the market broke support, hoping to recover his lost money (revenge trading).

However, seconds after placing his sell orders, the market shoots back up

because the manipulators close their sell positions, leaving retail traders holding losing trades.

This happens to countless retail traders worldwide, enabling manipulators to make millions at their expense.

Protect Your Trades from Manipulations

I don’t trade news events or get hyped about them;

I trade setups, not hype. If I spot an opportunity during a news release, I let the market wipe out impatient traders.

After the temporary unstable surge in price movements (± an hour),

I then look to enter under stable market conditions. This is one way I avoid market manipulation.

Protect Your Trades from Manipulations: Use High Timeframes

The lower you go down in timeframes; the more manipulations you can expect. Market manipulators target traders

who use lower timeframes (1 min – 30 min) more than those on higher timeframes (1 hr – weekly)

because less liquidity is required to move the markets.

Higher timeframes require significantly more liquidity, making manipulations harder to execute.

Difference Between Low and High Timeframes

It’s important to understand that you cannot avoid manipulation entirely as a retail trader.

However, you can control how much exposure you have to it by choosing your timeframes.

Low Timeframes

 Lower timeframes allow you to open and close trades within minutes or hours.

You don’t need to wait as long as you do with higher timeframes.

The downside is that there is a lot of market “noise” and frequent manipulations.

Fake breakouts at support and resistance areas happen often.

High Timeframes

 Higher timeframes are cleaner and less noisy, allowing you to make clear decisions.

The downside is that they require extreme patience.

When trading on high timeframes, you may find yourself holding positions for hours, days, or even weeks.

Understanding these differences is critical.

By knowing the obstacles you face, you can reinforce your trading psychology and develop better strategies for success.

Protect Your Trades from Manipulations: Overleveraging

Overleveraging can yield great returns, but it can also cause significant losses,

especially when manipulation is involved.

Market manipulation can wipe out your trading capital in seconds

if you don’t use proper risk management, regardless of your account size.

market manipulation

To protect your account from being wiped out,

implement a 1:3 risk-reward ratio: for every 1% risked, aim to make 3%.

This strategy gives you an edge over the market.

Even when manipulation occurs, your losses are minimized.

On days where manipulation doesn’t happen, you stand to make significantly more than what you may have lost.

Protect Your Trades from Manipulations: Conclusion

Protecting your trades from manipulation starts with adopting the right mind-set and strategy.

By trading with the overall market direction, avoiding unnecessary news-driven hype,

using higher timeframes, and implementing sound risk management,

you can minimize the risks posed by market manipulators.

While manipulation may never be fully avoided,

you can control your exposure and navigate the markets with confidence.

Remember, patience, discipline,

and proper strategy are your greatest tools as a trader. Stay focused, trade smart, and always protect your trades.

How Market Manipulation Targets Retail Traders

It is crucial to understand how market manipulation targets retail traders.

As retail traders, we don’t have the capital or resources to influence the price of currencies or stocks in the short or long term.

This lack of influence makes us frequent targets of manipulation,

with institutional players making millions by intentionally manipulating the markets.

As a result, retail traders must adopt strategies to navigate this game effectively.

What is Market Manipulation?

Market manipulation involves the artificial adjustment of currency, stock, or other security prices.

The manipulators, often large institutions or influential individuals, do this at the expense of retail traders.

The purpose may range from controlling consumer spending to making enormous financial gains.

Below, we will examine the individuals or institutions responsible for these tactics and explore their methods.

How Market Manipulation Targets Retail Traders: Hedge Funds

Hedge funds are corporations or private investment partnerships that pool capital from accredited investors and use it to generate profits.

How Market Manipulation Targets Retail Traders

Accredited investors are individuals who meet specific income or net worth requirements,

typically excluding middle- and lower-income individuals.

This regulation exists to protect less-wealthy individuals from the high risks associated with hedge fund investments.

The sole purpose of hedge funds is to maximize profits for their organization and investors,

treating everything else as collateral damage.

Instead of relying on fundamental or technical analysis, hedge funds create opportunities by engineering outcomes in the market.

Fear and Greed

A significant reason why over 90% of retail traders fail is the influence of fear and greed.

Hedge funds understand that human behavior is driven by emotion,

and they exploit this through psychological tactics that bait retail traders into unwise decisions.

 Many of these practices are entirely legal. For instance, hedge funds leverage traders’

fear of losing and their greed-driven FOMO (fear of missing out) to push them into ill-timed trades.

News Manipulation

The manipulation of news is a key tool used by both retail and institutional investors to influence market decisions.

How Market Manipulation Targets Retail Traders

Retail Traders and News Manipulation

Consider this scenario: a trader buys shares in a company called ShapeShifters. After making their purchase,

the trader posts glowing reviews of the company on social media, spreading rumours about its potential to dominate the market.

This kind of manipulation relies on virality, as more people buy shares based on exaggerated claims.

Hedge Funds and Strategic News Manipulation

Hedge funds use a more strategic approach. For instance, if they’ve entered a long position in ShapeShifters at $30/share

and want to exit without causing a massive sell-off, they might fabricate rumours about ground-breaking products or innovations.

By using their connections with major media outlets, they make these rumours appear true,

which retail investors spread further.

As retail traders pile into the stock, its price rises, sometimes to $40/share or more.

During this frenzy, hedge funds silently sell their shares, locking in profits.

When the fabricated rumours lose momentum and institutional players exit,

leaving only the retail traders with buy positions, the stock price collapses,

market manipulations

leaving retail traders with significant losses and hedge funds swimming in millions of profits.

Pump and Dump Schemes

A pump and dump is a securities fraud scheme

involving the artificial inflation of a security’s price using false or exaggerated claims.

Hedge funds employ this tactic to maximize profits with minimal risk.

Here’s how it works:

  1. Hedge funds enter a large buy position to inflate the stock’s price, causing volume indicators to attract retail traders.
  2. Retail traders mistakenly interpret this activity as a signal to buy, pushing the price even higher.
  3. Hedge funds sell their positions near the peak, leaving retail traders to bear the loss as the price plummets yet again making millions in the process.

How Market Manipulation Targets Retail Traders: Central Banks

Central banks also influence markets, often for macroeconomic goals rather than profit.

2008 Financial Crisis

However, their actions still impact retail traders.

Increasing Interest Rates

When central banks raise rates to control inflation, borrowing becomes more expensive

for consumers, small businesses, and corporations.

This decreases market activity, driving stock prices down but strengthening the currency.

Cutting Interest Rates

Conversely, central banks lower interest rates to stimulate borrowing and spending.

This boosts stock market activity but devalues the currency.

Such strategies can indirectly manipulate markets, as seen during the 2008 financial crisis

when central banks injected billions into the economy through quantitative easing.

How Market Manipulation Targets Retail Traders: Market Makers

Market makers, also known as liquidity providers, are essential for market operations,

but they also manipulate prices to profit from retail traders’ losses.

The Spread: Bid and Ask Prices

Market makers profit from the spread—the difference between the highest price a buyer is willing to pay (bid)

and the lowest price a seller will accept (ask).

This explains why trades often start with a small loss immediately after being executed.

Stop-Loss Hunting

Stop-loss hunting, often in the form of bull raiding or bear raiding,

involves placing large buy or sell orders to trigger stop-loss levels.

For example, market makers may push prices

above resistance to bait retail traders into entering buy positions.

Once stop-loss levels are placed just below resistance,

market makers inject large sell positions,

triggering the stop losses and causing further price declines making the markers millions from their short position.

How Market Manipulation Targets Retail Traders

How Market Manipulation Targets Retail Traders: Conclusion

Market manipulation is pervasive, with hedge funds, central banks, and market makers

all playing a role in targeting retail traders. However, with the right strategies and an understanding

of how the game is played, it is possible to join the small percentage of retail traders who achieve long-term success.

The key is staying disciplined, avoiding emotional decision-making,

and adapting to the realities of a market stacked against you.

Aligning Trading Patterns and Principles Explained

I remember two years ago when I was about to apply the concept of aligning trading patterns and principles.

My patterns, key levels, zones, trends, and impulse correction theory did not align at first.

They seemed to tell me different stories. For example, I would analyse a currency pair and spot a W pattern (indicating potential reversals for buying opportunities),

but at the same time, my key levels would signal a different narrative—price at a resistance level (indicating selling opportunities).

Aligning Trading Patterns and Principles

This contradiction left me wondering whether to buy or sell. I didn’t know—I only knew I had to enter the trade (FOMO took over). This lack of alignment led me to lose hundreds of dollars.

What It Takes to Master Alignment

The secret to mastering alignment is you. Unfortunately, that’s why many forex traders, whether they’ve been trading for months, years (unsuccessfully),

or have recently joined the industry, will never become profitable traders. The reason is simple: you are the key.

To effectively use patterns, trends, and key levels, you must master each concept and understand it inside out. Otherwise, you will struggle to align all these principles.

Your inability to stay focused and consistent will lead to failure. You need to have a deep conversation with yourself to assess if the way you are living or trading aligns with these principles.

If it doesn’t, make the necessary changes. As I mentioned earlier, your inability to stay focused and consistent will lead to failure.

Avoid These Behaviours

The reason many traders remain unprofitable, even after years of trading, is a lack of discipline, consistency, and problem-solving skills.

If you don’t learn from your losses or mistakes and keep repeating the same behaviours, you’ll find yourself stuck with a mountain of losses.

Aligning Trading Patterns and Principles

This stagnation prevents growth and evolution as a trader, no matter how long you’ve been in the industry. Don’t let yourself fall into that trap.

A lot of new traders fail because they enter the industry with unrealistic expectations of becoming millionaires within weeks or months.

I’ve been there, too. This mind-set is why many of them quit or never reach the next level.

Aligning Trading Patterns and Principles: How I Did It

As I mentioned, two years ago, I felt conflicted when my market patterns and principles didn’t align.

Instead of blaming my strategy, the market, or the market makers (as I often did back then), I acknowledged the problem and focused on finding solutions.

After months of losses, I went back to the drawing board and began by perfecting trends.

The more I analysed my setups and revisited them later (hours, days, or weeks), the easier it became to spot what I was doing wrong and what I was doing right.

Aligning Trading Patterns and Principles

Over time, this approach helped me understand trends effortlessly.

I applied the same method to patterns and principles, addressing each concept individually.

It wasn’t easy, but consistent practice, detailed note-taking, and determination helped me navigate through the challenges.

Eventually, I saw the light at the end of the tunnel. Always remember: focus on the skill, and the money will come; but focus on the money, and it won’t come as easily.

I made a habit of working diligently every day. I became so committed to perfecting my strategy that I stopped wasting time on distractions like partying.

The less attention I paid to the outside world, the better I became at aligning trading patterns and principles.

Aligning Trading Patterns and Principles: Step-by-Step

The reason I cover every topic individually in the Strategic Trading Academy is so you can thoroughly understand the principles of each concept—such as traditional trends, M&W reversal patterns, and trading psychology.

Once you achieve mastery, here’s your step-by-step guide to achieving total alignment:

Step 1: Trends

By this stage, you should have a clear understanding of how to apply trends. You should know which timeframes to use for analysis.

If you follow my weekly market breakdowns on YouTube, you’ll notice that I start by analysing trends on the daily timeframe.

Placing trends on the daily chart helps me determine if the market momentum is bullish or bearish. I then add trends on lower timeframes (4-hour or 1-hour charts).

Step 2: Key Levels

Next come key levels—critical points in the market where price reversals might occur.

At resistance levels, we look for selling opportunities; at support levels, we look for buying opportunities.

These levels are essential because they define my “playground,” giving me an idea of the potential pips I could gain over different timeframes (hours, days, weeks, or months).

By marking key levels on daily and 4-hour/1-hour charts, I can better predict whether a trend might reverse or break.

When trends and key levels align—for instance, when a bullish market is at a support level—it reinforces my confidence in my analysis.

Step 3: Zones

Zones, like key levels, are areas in the market where price reversals or continuations are likely.

The difference is that zones allow you to account for more price activity, enabling more informed decisions before entering a trade.

I use zones and key levels for different purposes. Key levels define my playground, while zones help me refine trades, scale in entries, or adjust stop-loss levels.

I apply zones on lower timeframes, such as 4-hour or 1-hour charts. Testing these tools extensively will help you understand what works best for your trading style.

For example, I used to create my playground using zones but later realized that it didn’t work for me in the long run.

Step 4: Impulse-Correction Theory

This is likely the easiest step. You need to train your eyes to spot impulsive and corrective price movements.

Consistent practice will sharpen this skill. Once your patterns, market levels, and zones align, allow the correction or pullback to occur.

When it breaks, enter the trade and capitalize on the impulsive price surge—provided it aligns with the previous steps.

Here’s an example of a trade I took on December 12, 2024.

total alignment
This is total alignment all in one picture. As you can see, I used the W pattern along with the inverted head-and-shoulders pattern, which indicates a potential buying opportunity. I also incorporated zones (scaling in a new entry), a support key level, and impulse correction theory before placing my entries.

Aligning Trading Patterns and Principles: Conclusion

This is my blueprint. Use it as a guide to improve your trading skills. Never give up, and always learn from your mistakes—otherwise, you’ll keep repeating them.

You don’t have to follow my strategy exactly. Everyone’s trading experience is different.

If you prefer starting your analysis on a weekly timeframe or exclusively using zones, that’s perfectly fine.

This blueprint is merely a starting point. Over time, as you gain confidence, you can adapt and refine it to suit your style.

2008 Financial Crisis Part 3

In this final part of the 2008 Financial Crisis Part 3 series,

we will explore the greed that fuelled the biggest crash to date and

how it nearly brought down the entire interconnected financial system.

If you haven’t read 2008 Financial Crisis Part 1, CLICK HERE, and for Part 2, CLICK HERE.

2008 Financial Crisis: CSE

As discussed in 2008 Financial Crisis Part 2, the U.S. Securities and Exchange Commission (SEC)

allowed investment banks to set their own leverage ratios under the

Consolidated Supervised Entities (CSE) policy.

To me, it seems the SEC didn’t give this policy any proper thought whatsoever.

This policy granted significant power to five major investment banks.

With this power, greed overtook their judgment.

Without considering the consequences,

 they began taking on so much debt that their reserves couldn’t even come close

to covering their losses if their holdings went sour.

In essence, even a beginner trader can tell there was zero risk management.

The 5 Investment Banks

1. Morgan Stanley 

2. Lehman Brothers 

3. Goldman Sachs 

4. Bear Stearns 

5. Merrill Lynch 

Let’s examine how each of these banks increased

their leverage ratios from the time the policy was issued in 2004 until 2007:

Morgan Stanley

• 2004 Leverage Ratio: 24:1 

• 2007 Leverage Ratio: 33:1 

• Increase: Approximately 38%

Lehman Brothers

• 2004 Leverage Ratio: 23:1 

• 2007 Leverage Ratio: 31:1 

• Increase: Approximately 35%

Goldman Sachs

• 2004 Leverage Ratio: 22:1 

• 2007 Leverage Ratio: 26:1 

• Increase: Approximately 18%

Bear Stearns 

• 2004 Leverage Ratio: 27:1 

• 2007 Leverage Ratio: 33:1 

• Increase: Approximately 22%

2008 Financial Crisis Part 3: How Leverage Ratios Work

To explain how leverage works, let’s use Bear Stearns’ leverage ratio from 2004 as an example.

First, you need to understand that a leverage ratio is the total assets divided by shareholders’ equity.

For Bear Stearns, the 27:1 ratio meant that the firm held $27 in assets (or liabilities, including borrowed funds)

for every $1 of equity. In other words, for every $1 of equity, Bear Stearns borrowed

an additional $26, making up the $27 in total assets.

Here’s a step-by-step example:

• Suppose Bear Stearns had $1 billion in equity. 

• This would translate to $27 billion in assets. 

• If the bank experienced a market loss of just 3.7% of total assets,

it would eliminate its equity reserves completely.

Isn’t that insane?

2008 Financial Crisis Part 3: The Beginning of Horror

In June 2004, the Federal Reserve (the Fed),

influenced by the U.S. government, began increasing interest rates.

Let’s revisit the context: In prior years, interest rates were cut to 1%

to prevent the U.S. economy from falling into a recession following the 9/11 attacks and the dot-com bubble crash.

Fast forward to 2004, and the Fed initiated a tightening cycle, gradually increasing rates.

• June 30, 2004: Rates rose from 1% to 1.25%. 

• September 21, 2004: Rates increased to 1.75%. 

• The hikes continued steadily, and by mid-2006, rates had soared to a whopping 5.25%.

This sharp increase in interest rates set the started one of the most horrific financial crises in modern history.

What Did It Mean to Home Lenders?

Before we address the horror about to unfold, we need to understand this: At the time, banks had issued a lot of loans based on the 1% rates.

Now that rates had jumped to 5.25%, this simply meant that many homeowners were about to default.

2008 financial crisis part 3

(Rising rates + low-income subprime borrowers = disaster.)

For many homeowners with low credit scores,

paying little to nothing in interest suddenly became unsustainable. For example:

• Old payment: $640 

• New payment: $1,100 

Home Prices Falling

Home prices began crashing due to widespread defaults (foreclosures).

In 2007 alone, approximately 1.3 million properties were foreclosed

upon, according to NBC News, further escalating the housing market crash.

2008 Financial Crisis: New Century Bankruptcy

Investors started witnessing the horrors that were about to unfold. In early 2007,

New Century Financial Corporation, one of the largest subprime mortgage lenders in the U.S., filed

for Chapter 11 bankruptcy on March 12, 2007.

This shook the market and contributed to a loss of confidence in the housing sector.

Investors scrambled to sell any investments tied to mortgage loans.

Interconnected Global System

The collapse of New Century Financial Corp

and subprime mortgages spread across the global system.

2008 financial crisis part 3

For example, after New Century Financial Corp filed for bankruptcy,

Northern Rock, a UK bank heavily exposed to the subprime mortgage market,

faced a bank run on September 14, 2007. This was the first bank run in over 100 years in the UK.

The UK government quickly intervened,

bailing out and later nationalizing the bank to prevent further financial distress.

The Madness Continues: Financial Crisis

In March 2008, the horror continued as Bear Stearns became the next casualty.

According to CNN Business, Bear Stearns, the fifth-largest bank in the U.S.,

had a market cap of approximately $15 billion before the crash.

Excessive leverage led to its downfall.

Bear Stearns was acquired by JPMorgan for just $2 per share,

with a $29 billion government bailout to address the liquidity crisis.

2008 financial crisis part 3

2008 Financial Crisis: Lehman Brothers Bankruptcy

According to the Corporate Finance Institute, Lehman Brothers,

the fourth-largest investment bank, had a market cap of $60 billion

 and was heavily invested in mortgage-backed securities and subprime loans.

Facing bankruptcy, Lehman Brothers attempted to raise capital but failed.

 Unlike Bear Stearns, the U.S. government did not bail out Lehman Brothers,

as main street opposed using taxpayer money to rescue Wall Street.

The UK government also blocked Barclays from purchasing Lehman Brothers.

On September 15, 2008, Lehman Brothers filed for bankruptcy.

Investors Lost Everything; Big Banks Made Billions

Banks like Morgan Stanley and Goldman Sachs began betting

against the same mortgage securities they were selling,

making hundreds of millions of dollars while investors lost everything.

2008 Financial Crisis: Recession

During this time of uncertainty, banks stopped lending

to each other due to shaken investor confidence.

This lack of credit led to massive job losses,

With the U.S. economy on the brink of a depression,

recession

hundreds of thousands of jobs were being lost each month.

Small businesses shut down, and over 2.3 million foreclosures occurred in 2008 alone.

The stock market crash wiped out trillions in retirement savings, putting financial strain on the middle class.

AIG Bailout

The U.S. government bailed out American International Group (AIG) because it was deemed “too big to fail.”

AIG’s collapse would have had disastrous to the global economy

consequences for banks and pension funds insured by it.

The bailout totalled approximately $182 billion, according to the U.S. Department of the Treasury..

Public Outrage

The Federal Reserve printed massive amounts of money and flooded the system,

which ultimately had to be repaid through taxes.

Hard-working civilians who had no role in causing the crisis bore the burden,

while big banks grew even richer.

2008 financial crisis part 3

Some argue that allowing these institutions

to collapse would have led to a Great Depression-like scenario,

Others believe the intervention only encouraged corruption and greed.

Quantitative Easing: Q4 2008

In November 2008, the Federal Reserve announced a quantitative easing program to combat the crisis.

They purchased $600 billion in mortgage-backed securities

and government debt to stabilize the housing market.

How Did This Affect Main Street?

The 2008 financial crisis led to massive job cuts and small business closures.

Over 2.3 million foreclosures occurred in 2008,

and the stock market crash wiped out middle-class retirement savings.

2008 Financial Crisis Part 3: Conclusion

The 2008 Financial Crisis demonstrated the devastating consequences of greed,

too much risk-taking, and a lack of effective due diligence .

From the SEC’s misguided policies to large leverage volumes,

these factors created a catastrophe that spread globally.

Millions suffered due to foreclosures,

unemployment, and lost savings.

While the intervention may have stopped the bleeding by preventing

the country from going into a depression,

it also left long-term challenges to address,

the aftermath left many questioning whether the benefits outweighed the costs.

As we close this chapter of financial history, it’s crucial to carry these lessons forward.

 In future articles, I’ll explore ways to hedge

against financial crises and equip you with tools to navigate uncertainty.

Stay tuned to learn how to protect your wealth and prepare

for potential challenges on the horizon.

Mastering Expanding and Contracting Channels: Technical Trading

In today’s piece, we will cover Mastering Expanding and Contracting Channels.

In our previous articles, I’ve discussed mastering the art of successfully trading Head and Shoulders patterns,

M and W patterns, and more for both bullish and bearish markets.

Mastering Expanding and Contracting Channels: Before We Begin

I urge you to read Mastering Technical Analysis: The Power of Price Action. If you’ve already read it, I recommend revisiting it.

Repetition is how we, as humans, are programmed to learn.

The reason I encourage you to read that article is because it covers traditional channels/trends, and this piece serves as an extension to that topic.

What to Expect Going Forward

To best approach this piece (Mastering Expanding and Contracting Channels),

start by reading a section—for example, expanding channels. After reading the entire section on expanding channels,

use the link provided in that section.

The link will direct you to my YouTube channel,

where I’ll demonstrate how to spot and capitalize on these channels. Once you’ve watched the video,

move on to the next section (contracting channels).

By doing so, you’ll effectively combine both theoretical and practical lessons offered in this article.

continuous learning

Take Action as Soon as Possible

After understanding the logistics of expanding and contracting channels,

it’s time to take action. You might wonder: How do I take action?

Start by analyzing charts and training your eyes to spot these patterns.

Through repetition and consistency, you’ll learn to identify these patterns with ease.

Once you spot one, practice taking advantage of these setups using a demo account until you’re comfortable applying them in a live trading environment.

Mastering Expanding and Contracting Channels: Expanding Channel

On my YouTube channel, I always emphasize the importance of having two identical trends

when trading a traditional bullish or bearish trend, like in the example below:

mastering expanding and contraction channels

However, this rule does not apply when trading expanding channels. Here’s an example of how they take form:

mastering expanding and consolidation channels

As you can see, the distance from support to resistance starts narrow but gradually

increases over time as the price moves between support and resistance.

An expanding channel acts as a consolidation pattern, and once it completes,

we typically see a strong impulse move—either to the upside or downside.

This is why I also encourage you to read my previous articles under The Strategic Trading Academy.

Just as a car requires various components to function optimally,

mastering what I teach requires you to study all the pieces I’ve written.

They work together to achieve maximum trading performance.

How to Capitalize Using Expanding Channels

There are two primary ways to capitalize on expanding channels:

  1. Trading Within the Channel
    This is effective when the pattern forms on the 1-hour, 4-hour, or daily timeframe.
  2. Trading the Breakout and Retest
    Wait for the market to break and retest the channel. Once the retest is complete, capitalize on the anticipated impulse move—either for buys or sells, depending on the overall trend.

CLICK HERE to access my YouTube channel, where I provide practical examples.

Mastering Expanding and Contracting Channels: Contracting Channel

A contraction is the exact opposite of an expanding channel. Instead of the price range expanding,

it contracts (narrows) as the price moves between support and resistance.

mastering expanding and contraction channels

A contracting channel differs from a traditional channel or trend.

The trends are not identical but instead form a triangular pattern that slopes to the right.

Once the price contracts to its maximum, we typically

see a breakout—either to the upside (bullish) or downside (bearish).

A contraction acts as a consolidation phase, and once it completes,

we can anticipate a strong bullish or bearish impulse movement.

How to Capitalize Using Contracting Channels

There are two main ways to capitalize on contracting channels:

  1. Trading Within the Channel
    This works when the pattern forms on the 1-hour, 4-hour, or daily timeframe.
  2. Trading the Breakout and Retest
    Wait for the market to break and retest the channel.
  3. After the retest, capitalize on the anticipated impulse move—either for buys or sells, depending on the overall trend.

CLICK HERE to access my YouTube channel, where I offer practical examples.

By understanding and practicing these techniques, you’ll enhance your trading precision

and take your technical analysis skills to the next level. Keep learning and refining your craft!

Mastering Expanding and Contracting Channels: A Key to Precision in Technical Trading

Mastering expanding and contracting channels is not just about spotting patterns—it’s about understanding market behaviour and positioning yourself for precision trades.

These channels provide unique opportunities to identify potential breakouts and capitalize on impulse moves.

By integrating theory with practice—whether trading within the channel or targeting breakouts—you can refine

your technical analysis skills and elevate your trading performance.

The journey to mastery requires consistent practice, repetition, and a commitment to learning.

Take the time to study these patterns, apply them in demo environments,

and gradually transition to live trading with confidence.

Remember, every successful trade begins with a solid understanding of price action and a disciplined approach.

Stay dedicated, keep evolving, and let expanding and contracting channels become a powerful tool in your trading arsenal.

Let’s conquer the markets, one pattern at a time!