
The only Trading view indicators you’ll ever need:
Have you ever felt drained when the market doesn’t follow your setups?
Or maybe you’re a beginner who just wants a clear direction: something simple, practical, and
honest?
If that’s you… you’re not alone.
And today, I want to show you the only TradingView indicators you’ll ever need.
Five AI-powered tools that sharpen your eye.
Five tools that help you trade like a professional.
Five tools that guide you until your own price-action awareness becomes strong enough to stand
alone.
Because the truth is simple:
Indicators help you learn the language.
But eventually… you become fluent.
Misunderstanding the Game: The Only Trading View Indicators You’ll Ever Need:

Where most traders lose themselves
Price action and trendline trading have built more traders than any other method.
Yet, it’s also the strategy beginners abandon the fastest.
Why?
Because they believe their setups “don’t work.”
Examples you already know:
• You buy at support → the market sells.
• You sell at resistance → the market buys.
• You enter a breakout → it reverses instantly.
This is where frustration starts.
And this is where many traders jump to new strategies, new indicators, new mentors…
without ever understanding the real issue:
It’s rarely the strategy.
It’s the skill.
Markets: whether it’s forex, indices, gold, crypto… will always include manipulation.
Beginners feel misled.
Pros see structure.
(Related read: “How Manipulation target forex traders…”)
The difference?
Pros know how to identify trends, levels, momentum, and market behaviour with precision.
But don’t stress… we’re about to break this down in a way that makes the chaos feel less like
chaos… and more like a language you’re finally starting to understand.
Why Indicators Matter (Especially at the Beginning)
When I started trading, I tested everything… tools, courses, robots, PDFs.
But the one thing that truly moved me forward
was the right set of indicators.
Not to shortcut the journey.
But to support it.
Over time, I learned to trade without them.
But if I’m being honest…
they saved me years.
And that’s why this blog exists:
to help you learn price action faster
without skipping the internal growth every conscious trader must face.
These five indicators work for scalpers, swing traders, day traders… anyone building an edge.
All you need is awareness… and consistency.
(Related read: “The Evolution of a Consistent Trader”… 1st piece of The Conscious Trader’s manifesto)
Let’s dive in.
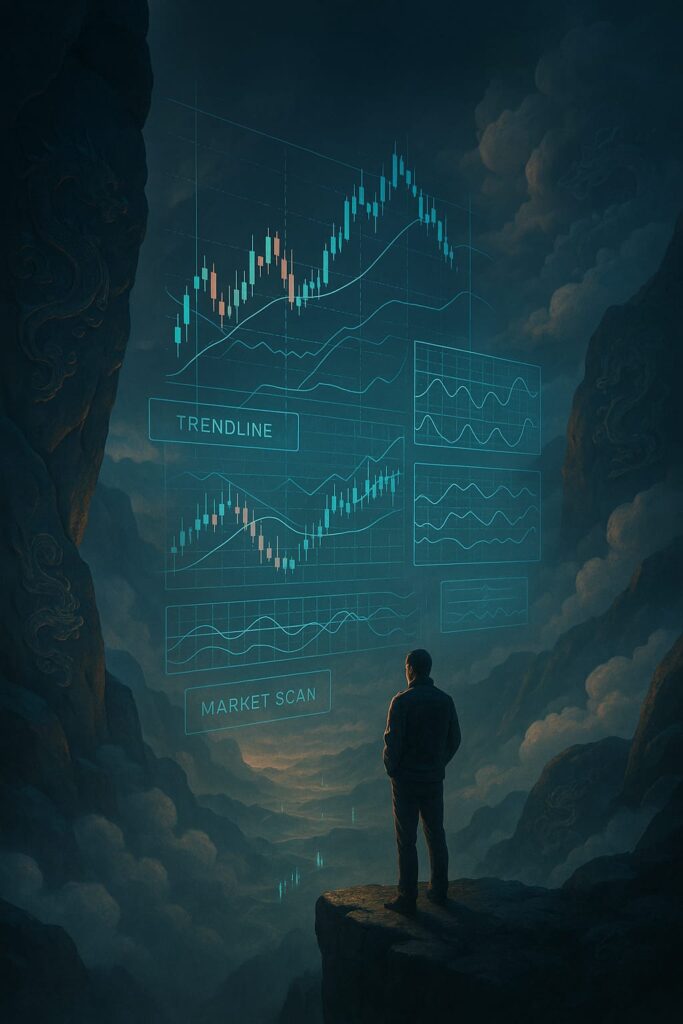
1. Trend Navigator
Your personal trendline mentor
One thing I see often when coaching traders
is how many struggle to draw trendlines properly.
Most don’t even notice when their trendline is off…
and that single mistake affects their whole system…
(Related read: “Blueprint of a consistent trader”… 2nd piece of The Conscious Trader’s Manifesto)
The Trend Navigator fixes that.
It compares your trendlines with AI-generated ones
so you can immediately see what you missed.
Bullish trends.
Bearish trends.
Reversals.
Exit zones.
It’s one of those tools that teaches you about the market…
but also teaches you about your own blind spots.
2. Support & Resistance Matrix
Where the market truly breathes
Demand and supply zones are the real turning points of the market.
Trendlines alone won’t carry your entire strategy.
When you combine both, something clicks.
Your confidence changes.
Your awareness sharpens.
This matrix reveals key zones: where buyers step in, where sellers take control, and where
liquidity hides.
Once you see these levels clearly,
price action starts making more sense than it ever has.
3. Market Scanner
Adapted to your style, not the other way around
Forex.
Indices.
Gold.
Oil.
Stocks.
Whatever you trade, the Market Scanner adjusts effortlessly.
And the best part?
You’re no longer glued to charts all day.
It sends alerts when your conditions are met:
like a bullish engulfing pattern, RSI dropping below 30,
or price breaking above the 200 MA.
(Related read: “The 200 moving average explained”… via Granite Shares)
Your entries become cleaner.
Your decisions become slower.
And slow decisions are powerful decisions.
It’s a tool for traders who value precision over noise…
and consistency over chaos.
4. Oscillator
The reversal compass
Every price-action trader needs to know when the market is reaching its limits.
Overbought → prepare for sells.
Oversold → prepare for buys.
Two tools stand out:
RSI: momentum.
Above 70 = overbought.
Below 30 = oversold.
MACD: trend momentum across timeframes.
It was one of the first indicators that helped me understand how trends breathe.
These aren’t “magic.”
They’re guides.
They whisper what the market is too loud to say directly
A Shortcut Most Never Talk About: The Only Trading View Indicators You’ll Ever Need

Not a cheat code: a clarity code
If you’re reading this far, it says something about where you are on your journey.
You’re hungry for clarity, not shortcuts.
You want mastery, not gambling.
So here’s something most won’t admit:
You can master trendlines, key levels, momentum, entries… faster
with the right tools supporting your awareness.
And if you’ve ever felt like you “almost get it”…
it might mean you just need something to bridge the gap
between what you see
and what the market is actually doing.
(Related read: “Rebuilding The Inner Trader”… is 3rd piece of The Rebirth of Independence series)
The Tools That Build That Bridge: The only Trading view indicators you’ll ever need
For traders who want to level up their skill
without spending years trying to figure it out alone,
these five VIP TradingView indicators create that bridge.
Not hype.
Not a miracle.
Just clarity.
Clarity that helps you rebuild your inner trader
while learning how the market actually moves.
( Related Read:” The Trader’s Final Year“… the 4th piece of The Rebirth of Independence 4 piece series)
They offer:
• 24/7 access
• Clear trend detection
• Precise support/resistance mapping
• Smart market scanning
• Alerts on all your conditions
• Compatibility across all markets
• Support when you need guidance
If you’re serious about mastering price action
and developing your own conscious trader edge,
they’re a powerful stepping stone.
➡️ [Click here for 24/7 access to VIP TradingView Indicators]
Not a push.
Not a pitch.
Just an option for traders who are ready to rebuild
with more structure and less guesswork.
Conclusion: The only Trading view indicators you’ll ever need
The market is a dialogue; learn its language
Mastering price action takes patience.
But the right tools can dramatically shorten your learning curve
without skipping the personal transformation that consistency demands.
These TradingView indicators help you:
• identify trends
• find reliable levels
• scan markets
• understand momentum shifts
• and trade with more awareness
They’re especially helpful if you’re rebuilding your foundation
after frustration, inconsistency, or emotional collapse.
(Related read: “The Collapse Before the Rise”… 2nd piece of The Rebirth of Independence)
Because once you start seeing the market clearly,
your inner trader starts rebuilding himself too.
And that’s where the real transformation begins.