
This is Part 2 of Africa’s Guide to Forex, an in-depth journey through the essential elements every African forex trader must know.
Risk Management: Africa’s Guide to Forex Part 2
Africa’s guide to forex would be incomplete without understanding risk management because the forex market is highly volatile and unpredictable.
Without proper risk control, even experienced traders can suffer significant losses.
Here’s a detailed breakdown of forex risk management:
Understanding Different Types of Forex Risks
- Market Risk – Price movement going against your position.
- Leverage Risk – Amplified gains and losses due to leverage.
- Liquidity Risk – Infrequent trading volumes causing execution issues.
- Interest Rate Risk – Affected by central bank decisions.
- Political & Economic Risk – Geopolitical events affecting currency values.
- Psychological Risk – Emotional, impulsive trading decisions.
Key Risk Management Techniques
- Position Sizing – Risk only 1-2% of account per trade.
- Stop-Loss & Take-Profit Orders – Predetermined exit points.
- Risk-to-Reward Ratio – Aim for 1:2 or 1:3.
- Diversification – Avoid over-concentration in one pair.
- Avoid Over-Leveraging – Use leverage cautiously.
- Trade During High Liquidity – Best during London and New York sessions.
- Stay Updated on News – Monitor economic calendars.
- Demo Trading – Practice before going live.
Risk Management Example
Account balance: $10,000
Risk: 2% per trade = $200
Setup: 20-pip stop loss / 40-pip take profit = 1:2 RR
Psychological Aspect:
- Control Emotions – Fear and greed kill accounts.
- Stick to the Plan – Avoid unplanned entries.
- Accept Losses – No strategy is 100% accurate.
- Avoid Revenge Trading – It leads to irrational losses.
Final Thoughts:
Effective risk management ensures long-term survival. Prioritize preservation over profits. Discipline beats luck every time.
What Is a Forex Chart: Africa’s Guide to Forex Part 2?
A forex chart is a visual tool showing price movement of currency pairs over time. It includes open, high, low, and close (OHLC) prices and helps identify trends and patterns.
- Y-axis: Price
- X-axis: Time
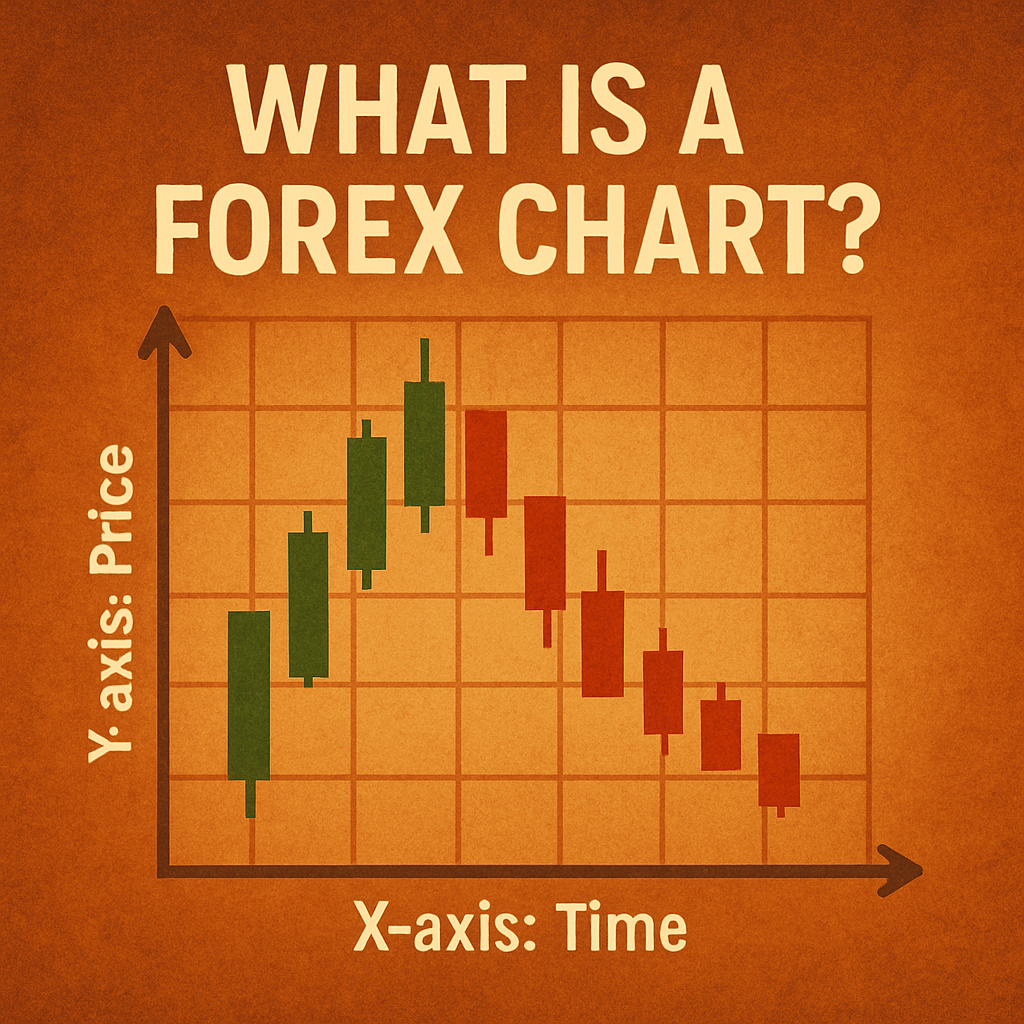
What Is a Candlestick?
A candlestick shows how price moved during a specific timeframe.
- Real Body – Difference between open and close.
- Green/White: Closed higher
- Red/Black: Closed lower
- Wicks/Shadows – Highs and lows of the session
Originating from 18th-century Japan, candlestick patterns are used worldwide in technical analysis.
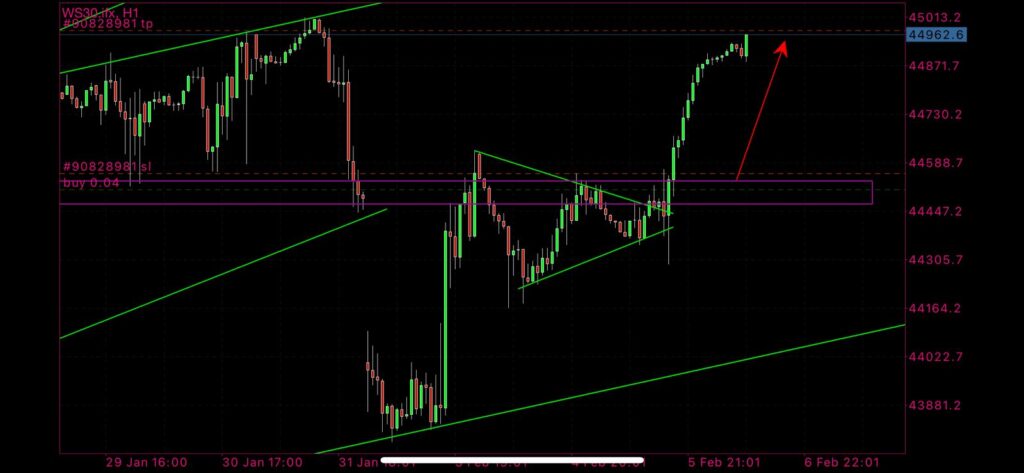
What Is a Trend?
A trend shows whether prices are generally moving up or down.
Bullish Trend
- Higher highs and higher lows
- Trendline acts as support
Bearish Trend
- Lower highs and lower lows
- Trendline acts as resistance
Trend Following System
- Impulses – Large, fast price movements in trend direction
- Corrections – Slower retracements within trend
- Sideways (Consolidation) – Prices move within a range
What Is a Pattern?
Chart patterns repeat over time and can predict price movement.
- Traditional Patterns – Head and shoulders, double tops/bottoms
- Candlestick Patterns – Doji, engulfing, etc.
- Harmonic Patterns – Fibonacci-based formations
Patterns are categorized as:
- Reversal – Trend changes
- Continuation – Trend resumes
- Bilateral – Price may move either way
What Is Price Action: Africa’s Guide to Forex Part 2?
Price action refers to the raw movement of price over time. It’s the foundation of all technical analysis.
Key Takeaways:
- Focuses on highs, lows, opens, closes
- Used to find breakouts, reversals, and trends
- Prior price does not guarantee future results
Understanding Price Action
Traders use charts (especially candlesticks) to analyse price history. No indicators: just pure market structure.
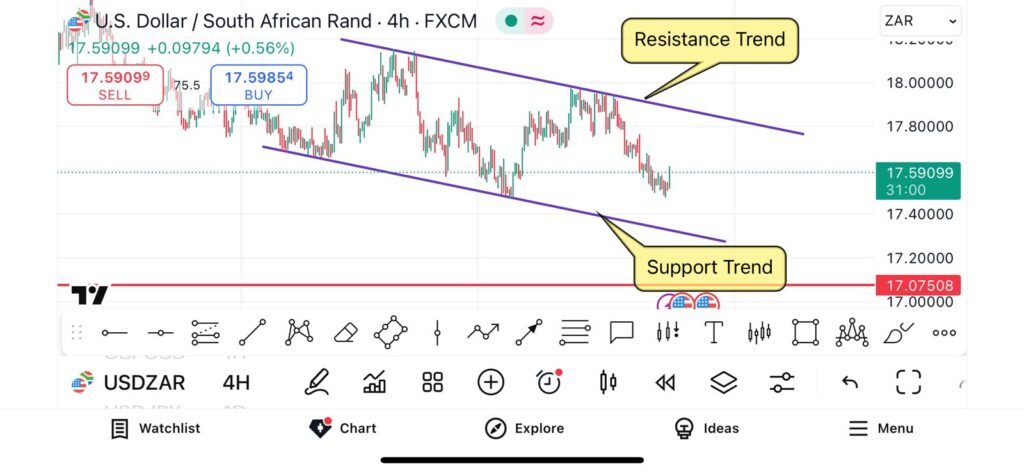
What Is Support and Resistance (Supply & Demand)?
Support and resistance levels are zones where price historically reacts.
- Support – Price level where demand overcomes supply
- Resistance – Price level where supply overcomes demand
Characteristics
- Identified via trendlines or moving averages
- Used to place entries, exits, and stops
What Are Timeframes in Trading: Africa’s Guide to Forex Part 2?
A timeframe refers to the duration of trade positions.
Types:
- Intraday – Buy and sell on same day
- Swing – Hold for days to weeks
- Positional – Hold for months to years
Timeframe Affects:
- Trading style
- Risk exposure
- Emotional demands
Highs and Lows
Higher Highs
- Bullish structure; each peak is higher than the last
Lower Lows
- Bearish structure; each dip is lower than the last
Higher Lows
- Bullish sign; buyers stepping in sooner
Lower Highs
- Bearish sign; sellers dominating earlier
Use trendlines to interpret these structures and find entries.
What Are Forex Trading Tools: Africa’s Guide to Forex Part 2?
Tools shape how you see the market:
- Indicators
- Trendlines
- Economic calendars
- Sentiment tools
Using the right tools makes your setups stronger and more consistent.
Conclusion: Africa’s Guide to Forex Part 2
Part 2 of Africa’s Guide to Forex took you deep into the technical: risk management, trends, price patterns, and trading tools.
Now that you’ve built a solid foundation, you’re better equipped to recognize setups, manage trades wisely, and evolve into a strategic trader.
Stay disciplined. Keep studying. Your forex journey continues.