Secret of Success: Mastering M’s/W’s

Secret of Success: Mastering M’s/W’s

Welcome to the Advanced Trading Academy, where we will be exploring the secret of success in trading.

Our first lesson will primarily focus on patterns that the market tends to repeat over and over again.

secret of success

It is important for you to click the links provided in the upcoming headings because they will lead you straight to the practical lessons.


Always take notes to ensure you don’t forget any valuable information,

as this can be the difference between winning and losing in the long term.

Mastering M’s and W’s Patterns

The first rule for successfully trading M’s and W’s patterns is to understand

that these patterns occur at support and resistance areas.


As we always say, look for buying opportunities at the support areas and look for selling opportunities at the resistance areas,

as covered in the basic strategy of our academy.

Secret of Success: Mastering M Pattern

M patterns always occur at the resistance area, whether in a bullish trend,

bearish trend, or consolidation trend—the rule remains the same.

Secret of success


If you spot one anywhere else, you should not trade it,

as it could mean that market makers are trying to trap you.

By knowing this secret of success, you are already ahead of many traders

who have been attempting to trade this pattern but consistently fail to get it right.

Decoding the Secret: Importance of M’s

Understanding the importance of M patterns is crucial.

M patterns strengthen the continuation of a trend.

Trends that don’t experience reversal patterns like M’s at the resistance lack merit.

If you spot a trend without reversal patterns like M’s,

entering at the resistance means our trades won’t have high probability.

At Funds and Galore, we encourage our students to only place entries with high-probability setups.

Secret of Success: Mastering W Pattern

W patterns always occur at the support area, whether in a bullish trend,

bearish trend, or consolidation trend—the rule remains the same.

If you spot one anywhere else, you should not trade it,

as it could mean that market makers are trying to trap you.

Knowing this secret of success puts you ahead of many traders who consistently fail to get it right.

Watch how we successfully trade these patterns in the practical course, which will be presented to you shortly.

Decoding the Secret: Importance of W’s

Understanding the importance of W patterns is essential. W patterns strengthen the continuation of a trend.

Trends that don’t experience reversal patterns like W’s at the support lack merit.

If you spot a trend without reversal patterns like W’s,

entering at the support means our trades won’t have high probability.

At Funds and Galore, we emphasize that our students place entries with high-probability setups.

To do this successfully, you also need to master the skill of being a patient trader.

This will help you grow your account over time and balance trading with your personal life.

Professional traders don’t spend all day looking at the charts;

instead, we spend less than two hours in the market.

Secret to Success: How to Approach the Practical Lesson

The first practical lesson will show you how to trade these patterns effectively.

Stay tuned and prepare to put these insights into action.

Conclusion

Mastering the M and W patterns at their respective support

and resistance areas is fundamental for successful trading.


Understanding these patterns allows you to make high-probability

trades and avoid common traps set by market makers.


At Funds and Galore, we prioritize high-probability setups and emphasize patience and strategy.


By focusing on these principles and integrating them into your trading routine,

you can achieve consistent success and maintain a balanced lifestyle.

Stock Market Bubble History

The History of the Stock Market

Welcome to the second article in my series following the previous piece, “Our Financial History,” under the category of Forex and Stocks. In this article, we will dive into the stock market bubble history.

to uncover why our economy today is so intertwined with the stock market.

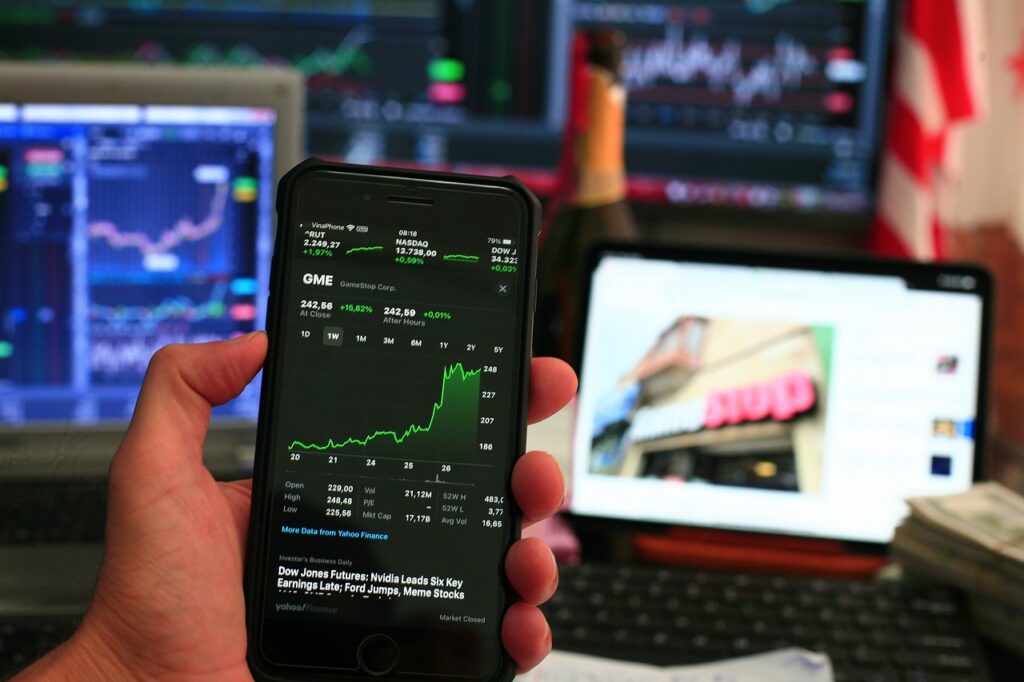
Some of you may have noticed my passion for stocks, evident in my trading activities.

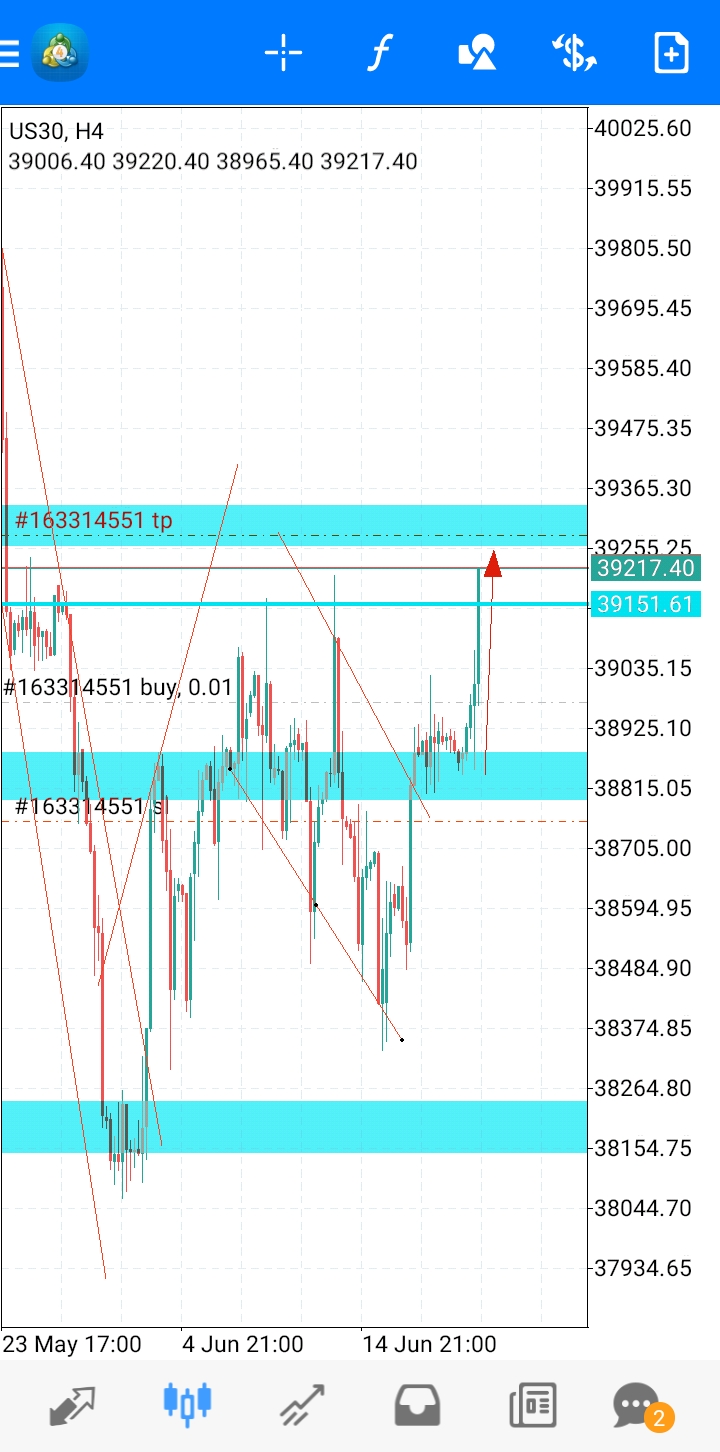
For those unfamiliar with my background, I primarily trade indices—

these are groups of publicly traded stocks such as the Nasdaq 100, USA 30, German 30, and S&P 500.

The stock market is a platform where companies offer their shares to the public through an Initial Public Offering (IPO).

This allows investors, like you and me, to buy and sell company shares flexibly,

investing any amount of money we’re willing to risk to generate a return.

Now, let’s journey back to ancient Greece to trace the early practices of the stock market.

The Voyage of Pythons

History tells us that during ancient Greece’s maritime trade and exploration era,

ship captains realized the benefits of raising funds to finance their voyages.

These expeditions were expensive and risky.

Stock Market Bubble

The primary risk was that the captain’s ship might get lost at sea, never to return.

Another risk was the possibility of returning with nothing valuable.

Additionally, captains had to account for the costs

of ship maintenance, crew payments, supplies, and cargo.

The Importance of Investors: History of the Stock Market

Investors were the lifeline of these long and risky voyages,

providing the necessary liquidity to finance explorations.

However, their motivation was not altruism;

they were speculating that their investment would allow the captain

and crew to travel to distant lands and return with valuable goods.

Stock Market Bubble

These goods would be sold upon arrival, and the profits distributed accordingly.

If the voyage was successful, the investor, captain,

and crew would share the profits. However,

if the crew returned empty-handed or the ship was lost,

everyone, including the investors, would incur losses.

These agreements laid the foundation for what we now know

as venture capitalism and joint-stock companies.

Dutch East India Company of the 1600s: Stock Market Bubble

The Dutch East India Company, known as the Vereenigde Oostindische Compagnie (VOC),

was founded in the early 1600s in the Netherlands.

This company was one of the first to function as a joint-stock company.

Initial Public Offering (IPO)

What is an IPO, you may ask? Well, to put it simply,

an Initial Public Offering is when a private company decides to issue shares to the public for the first time.

Stock Market Bubble

This allows anyone with internet access to buy and sell shares of companies with each other in real-time.

In the modern day, anyone who has capital and internet access can buy and sell shares of publicly traded companies.

Why Private Companies go Public

The benefits of private companies going public include raising a large

amount of capital for expansion, such as building more factories,

which creates more jobs, paying off previous debts to improve balance sheets,

and increasing the company’s visibility to a larger audience.

Stock Market Bubble
You can have a good product, but if your business is not visible, you won’t drive sales.

IPOs have been around for far longer than we have existed.

This is why I stress the importance of referring back to our history;

through understanding our history, we become better adapted to forecast our present and our future.

The First Initial Public Offering (IPO)

During the early 1600s, the Dutch East India Company was interested in getting involved in international trade,

but the problem they faced was that the company did not have enough capital to finance the project.

So, the VOC issued the first IPO to raise funds beginning a stock bubble .

Over time, they were able to sell these shares to individuals or organizations that could afford to purchase them,

like merchants and affluent citizens. As more and more of these shares were sold,

it eventually reached a point where shareholders could buy and sell them from one another.

For example, if two merchants, Mr. Bakker and Mr. Achterberg, bought shares from VOC (let’s say 1 share = $50)

at the time they purchased these shares. Mr. Bakker buys 5 shares, and Mr. Achterberg buys 2 shares.

As more and more merchants and shopkeepers rushed to buy these shares, the demand increased,

causing the share price to rise from $50 to $85 per share.

Let’s work out Mr. Bakker and Mr. Achterberg’s profits if they were to sell at the current market price.

Step 1: Example of Share Purchase

  • Merchant Mr. Bakker buys 5 shares at $50 each.
  • Merchant Mr. Achterberg buys 2 shares at $50 each.

Step 2: Increase in Share Price

  • As more people rushed to buy shares, the demand increased, causing the share price to rise from $50 to $85.

Step 3: Calculating Profits

Mr. Bakker’s Investment and Profit:
  1. Initial investment: 5 shares × $50 = $250
  2. Current market value: 5 shares × $85 = $425
  3. Profit: $425 (current value) – $250 (initial investment) = $175
Mr. Achterberg’s Investment and Profit:
  1. Initial investment: 2 shares × $50 = $100
  2. Current market value: 2 shares × $85 = $170
  3. Profit: $170 (current value) – $100 (initial investment) = $70

Step 4: Summary of Profits

  • Mr. Bakker made a profit of $175.
  • Mr. Achterberg made a profit of $70.

By issuing the first IPO, the VOC was able to raise capital for its trading ventures,

benefiting early investors like Mr. Bakker and Mr. Achterberg from rising

share prices which lead to an early stock market bubble.

Share prices could fluctuate based on rumors,

and a drop from $85 to $30 per share could trigger panic selling, causing further declines.

Shareholders had limited liability, meaning they would only lose their investment

if the company went insolvent and wouldn’t be liable for the company’s debts.

VOC shares were traded on the Amsterdam stock exchange.

The Expansion of the VOC Empire

Profits from new projects, such as vast trade networks for spices, silk, and tea,

allowed the VOC to establish colonies and trading camps in areas

like the Cape Colony (South Africa), India, and Indonesia.

Stock Market Bubble

The company built a monopoly, including factories

and the ability to negotiate trade agreements with local rulers.

Stock Market Bubble History: Conclusion

The Dutch East India Company came to an end in 1799.

The government seized its vast monopoly colonies

due to the company’s long-term debt,

corruption, and increasing competition as rivals began issuing their own shares.

The VOC has left a lasting influence on today’s corporate world.

It’s important to note that when a company’s share prices dropped during that time,

only the shareholders and the company bore the consequences, not the entire economy.

In contrast, a stock market crash today affects the whole economy,

impacting everyone whether they invest or not.

The history of stock market bubbles reveals that while the fundamental mechanics

of investing and speculation have remained consistent,

the scale and interconnectedness of modern markets have drastically increased.

Understanding these historical events helps us grasp the roots of

today’s market dynamics and the potential risks involved.

By learning from past bubbles, investors and policymakers can better navigate the complexities

of modern financial systems, aiming to mitigate the impact of future market disruptions.

The Collapse of the Big Banks: Financial Crisis of 2008, Part 2

The Collapse of the Big Banks: Introduction

This article, “The Collapse of the Big Banks, Part 2,” continues from my previous piece titled “2008 Financial Crisis, Part 1.”

In the earlier article, we discussed laws passed in the ’90s, such as

the Community Reinvestment Act of 1977, amended in 1995,

which aimed to combat discrimination against lower-income home borrowers.

In 1999, President Bill Clinton passed the GLBA Act,

repealing key provisions of the Glass-Steagall Act of 1933.

The Collapse of the Big Banks

With these fundamental forces at play, Wall Street capitalized

on the opportunity by creating Collateralized Debt Obligations (CDOs).

In my previous article, I explained that a CDO works

like three cascading trays: the top tray being the least risky,

the middle tray moderately risky, and the bottom tray the riskiest.

Problems that Followed the Use of CDOs: Financial Crisis

As mentioned, CDOs were inherently risky because they mixed prime loans

with subprime loans. Before diving into the ensuing horror,

let’s consider the perspective of the institutions that issued CDOs.

When the government passed legislation like the Community Reinvestment Act of 1977,

it legally forced banks to lower interest rates to accommodate community

members who previously couldn’t afford these loans.

The collapse of the big banks

This exposed banks to high risks since subprime lenders are prone to defaulting.

A CDO allowed banks to pass some of the risk to investors who

purchased them while making billions in the process.

Credit Rating Agencies: The Collapse of the Big Banks

Rating agencies like Moody’s were heavily criticized and blamed for the 2008 financial crisis.

Notably, Warren Buffett’s Berkshire Hathaway owned 13.5% of Moody’s stock during the crisis.

This raises the question: How could a rating agency like Moody’s

be criticized when a renowned investor owned a significant stake?

The collapse of the big banks
Warren Buffett, a philanthropist and well-renowned investor known for his unique style of investing, is the CEO and chairman of Berkshire Hathaway.

The problem arose when institutions and lenders of CDOs allowed many

American citizens to obtain mortgages without proper oversight.

When the situation spiraled out of control, banks turned to

credit rating agencies to evaluate the risk associated with CDOs.

Instead of providing accurate evaluations, these agencies rated

the bundled investments as triple-A (AAA), the highest credit rating.

This AAA rating misled investors into believing these investments were safe,

even safe enough for pension funds. This should be considered one of the biggest financial crimes ever committed.

Why Did the Credit Rating Agencies Give False Ratings?

The reason why credit agencies rated the CDOs with a triple-A rating was twofold: firstly,

they didn’t want these institutions who issued them (investment banks, commercial banks, etc.)

to go to their competitors who might give them the triple-A

rating they wanted if they themselves did not do so.

Secondly, these rating agencies made billions

by giving these risky securities a triple-A (AAA) rating.

The collapse of the big banks

The CEOs of such institutions typically earned their salaries

in the form of salary, bonuses, and stock options.

Why Were Financial Institutions Adamant About Getting a Triple-A Rating?

Financial institutions aimed to mitigate their risk by selling CDOs to investors.

It was important for them to get the triple-A rating

because a triple-A rating meant that more investors would buy these risky securities.

The amount of money they got as compensation was enormous.

For example, the CEO of Lehman Brothers,

Richard Fuld, earned around $22 million in 2007, a year before the collapse of Lehman Brothers.

The CEO of Merrill Lynch, Stanley O’Neal, earned a staggering $161 million when he resigned in 2007.

The Creation of the Credit Default Swap: The Collapse of the Big Banks

The next part of the story is where everything gets even more chaotic with the invention of Credit Default Swaps (CDS).

According to Tim Vipond, a credit default swap is a form of credit derivative

that acts as protection against default for investors who purchase them.

He continues by stating that with the purchase of a CDS,

the purchaser agrees to make periodic payments to the seller until the credit maturity date.

Financial Crisis 2008

Therefore, in return, the seller agrees that if the debt issuer defaults,

the seller will have to pay, by agreement,

all the premiums and interest that would’ve been paid up to the date of maturity.

Allow me to make an example for clarity:

Mr. Stark gets a mortgage from ABC Bank to purchase a house, resulting in Mr.

Stark making his monthly repayments (principal + interest)

to ABC Bank. In this scenario, Mr. Stark is a subprime lender.

Financial scientists and mathematicians from Wall Street created

a CDS to act like insurance for ABC Bank.

An insurance company would offer this product to ABC Bank,

meaning that when the bank receives monthly payments from Mr. Stark,

ABC Bank would pay the insurance company a premium

(by giving the insurance company a portion of the interest made from Mr. Stark’s monthly payment).

ABC Bank didn’t mind this because it meant their risk was lower,

and if Mr. Stark defaulted on his payments,

the insurance company would have to cover Mr. Stark’s payments to ABC Bank.

How Big Was the Credit Default Swaps Market?

In 2007, the credit default swap market was estimated to be around $45 trillion, while the stock market averaged $22 trillion,

$7.1 trillion in mortgages, and $4.4 trillion in U.S. Treasuries. Alarming, isn’t it? But it gets worse.

The Collapse of the big banks

How Did the Big Banks Use CDS as a Hedge Against MBS: The Collapse of the Big Banks?

Mortgage-backed securities (MBS) were a bunch of bundled-up mortgages that banks issued as securities,

which were eventually sold to investors. So basically,

MBS was backed by mortgage payments from homeowners

(like Mr. Stark, for example), meaning that investors’ returns were

dependent on homeowners paying off their mortgages.

What happened next was that these institutions (the big banks) used

credit default swaps as a hedge against mortgage-backed securities.

They were betting against their own clients (borrowers of the mortgage loans). This created

a conflict of interest—banks were actively encouraging investors to purchase these MBS

while at the same time betting they would fail. Sounds like a script from a Hollywood movie.

The Big Banks Let Greed Consume Them: The Collapse of the Big Banks

By this time, the banks did not look like they were slowing down. They continued to bet way too much,

betting far more than they had in their reserves.

The reason these institutions were allowed to do so was because CDS were not technically insurance;

they were swaps, meaning that banks did not need all that money in

their reserves to back up their bets if they were wrong.

Consolidated Supervised Entity (CSE) Program

In 2004, the U.S. Securities and Exchange Commission (SEC), through this program,

allowed these big institutions to decide how much money they needed

to keep in their reserves to cover their bets when they went wrong.

This was a fundamental mistake created by the SEC (I’m wondering to myself why they allowed such).

This meant that banks now had even more freedom to reduce the amount

of reserves and maximize their investing and lending practices.

Leveraging

End of Part 2 of the Big Banks: The Collapse of the Big Banks

I know I left you on a cliffhanger, but this is not the end of the series on the financial crisis of 2008.

Another article will be posted. The reason for this is simply so that I don’t

force everything into one article. Now let’s do a quick recap of what we covered in this article.

In this part of “The Collapse of the Big Banks,”

we explored how risky financial products and poor oversight led to the 2008 crisis.

We discussed how Collateralized Debt Obligations (CDOs) mixed safe and risky loans, tricking investors.

Credit rating agencies like Moody’s rated these risky investments as very safe (AAA),

misleading many and making billions in the process.

Executives of big banks earned huge salaries and bonuses while pushing these dangerous products.

We also looked at Credit Default Swaps (CDS), which were supposed

to protect against defaults but ended up being used by banks to bet against their own clients.

Finally, we talked about how the SEC’s 2004 rule changes

let banks keep less money in reserves, allowing them to take on even more risk.

Mastering Technical Analysis: The Power of Price Action

Understanding Price Action

Mastering technical analysis requires a solid grasp of price action. Price action refers to the movement of the overall market price.

Retail traders utilize price action to discern whether the market is bullish or bearish, using this insight to make calculated trades.

When an index like the Nasdaq is bullish, it simply means the market is trending upwards. Conversely,

Mastering Technical Analysis

when the Nasdaq index is bearish, it indicates that the market is trending downwards.

Mastering Technical Analysis

Retail traders who understand price action study past market trends to predict future market movements, enabling them to make informed and strategic trades.

Mastering Technical Analysis

Technical analysis encompasses various techniques that retail traders use to make calculated decisions on whether to buy or sell forex pairs (e.g., EUR/USD, GBP/USD) or indices (e.g., S&P 500, Nasdaq 100).

How Do Retail Investors Know When to Buy or Sell?

The reason many traders fail to make a profit is that they struggle to apply technical analysis effectively.

This prevents them from identifying whether they are strong buyers or sellers. It is crucial to trade with the market, not against it,

because we do not control the market—we only follow it. To understand the flow of price, one must first recognize that the market moves in three trends.

Bullish Trend

A bullish trend indicates that a specific stock, index, or commodity is performing well.

For example, when we observe a bullish market in Apple (AAPL) stock using technical analysis, it signals that retail traders should ideally look for buying opportunities (trading with the market).

Conversely, traders seeking selling opportunities in a bullish market are essentially trading against the market.

I personally do not recommend trading against the market. While it is achievable through practice,

I wouldn’t advise it, especially for beginners. I will teach you how I trade personally, not strategies I don’t use.

Mastering Technical Analysis

Bearish Trend

A bearish trend, identified through technical analysis, informs us that a specific stock, index, or commodity is underperforming.

For instance, a bearish market in Tesla (TSLA) stock suggests that retail traders should ideally look for selling opportunities (trading with the market).

On the other hand, traders seeking buying opportunities in a bearish market are trading against the market. Again, I don’t recommend trading against the market. Though possible with experience, it’s not advisable for those just starting out.

Consolidation Trend

The last trend you may encounter is a consolidation trend, which occurs when the market is indecisive.

This trend signifies a balance between sellers and buyers. Seasoned traders often watch for these trends as they can also be profitable.

Typically, after a period of consolidation lasting a week or so, the market often breaks into a bullish or bearish trend.

What to Expect: Mastering Technical Analysis

It’s important to recognize that trading is a game. Just like playing FIFA with friends, sometimes you win, sometimes you lose. Forex trading operates on the same principle.

Your goal is to avoid letting losses affect your mindset. Similar to FIFA, where your objective is to equalize and then score to win,

Mastering Technical Analysis
A stop-loss and take-profit order empower you to manage your potential losses and gains effectively.

in forex, your goal is to outperform the market. How does one achieve this, considering only a mere 10% succeed? The answer lies in mastering technical analysis.

I’m excited to teach you how to use price action to your advantage, helping you become part of the successful 10%.

I will show you exactly how to trade in bullish, bearish, and even consolidation channels using technical analysis.

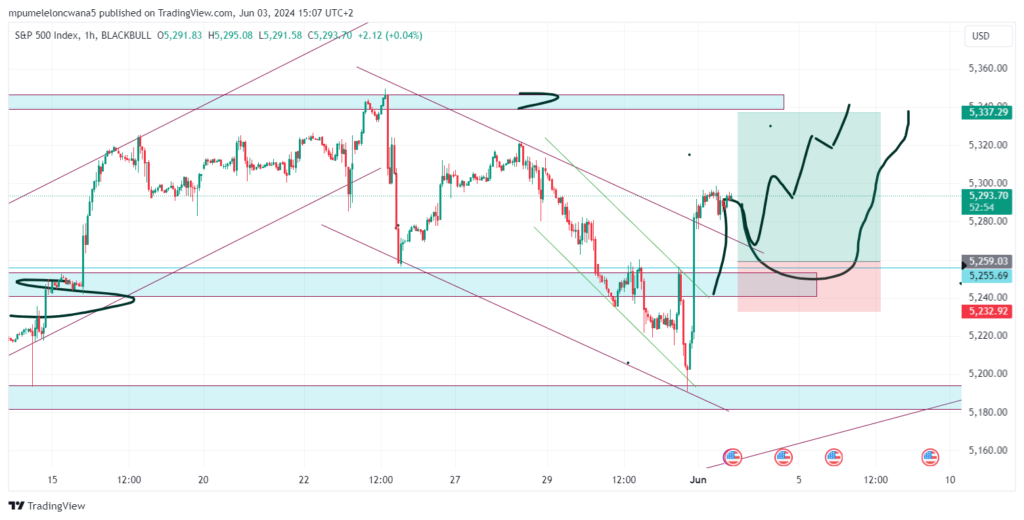
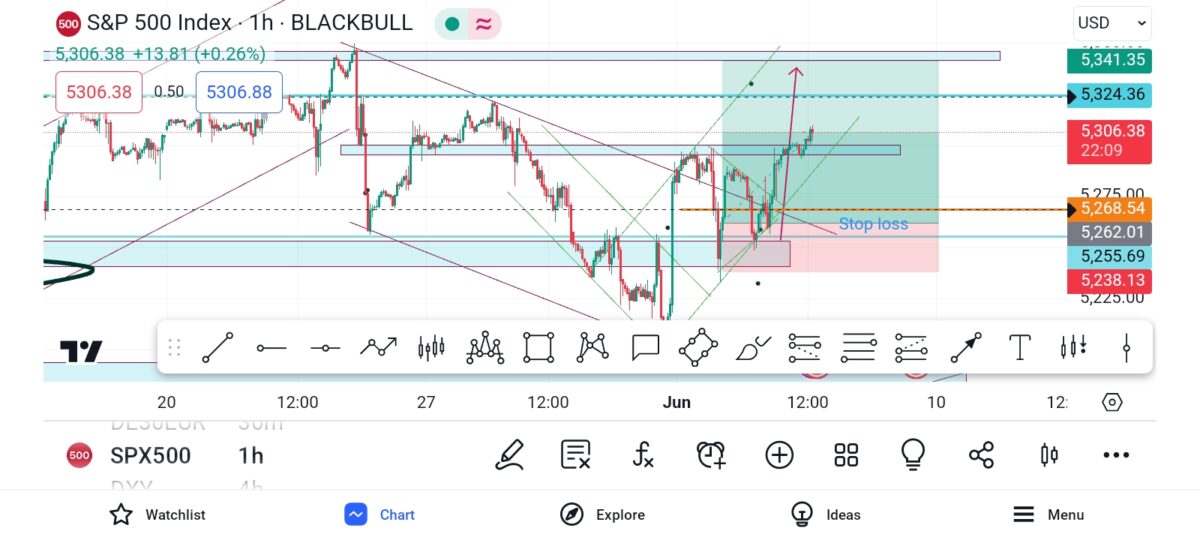
Mastering Technical Analysis: Support and Resistance

Support and resistance are areas in the market where traders look for buying or selling opportunities.

At resistance levels, traders typically look for selling opportunities because the market often reverses downward from these points.

Conversely, at support levels, traders look for buying opportunities because the market often reverses upward.

I continuously emphasize the importance of using stop-loss orders in my teachings.

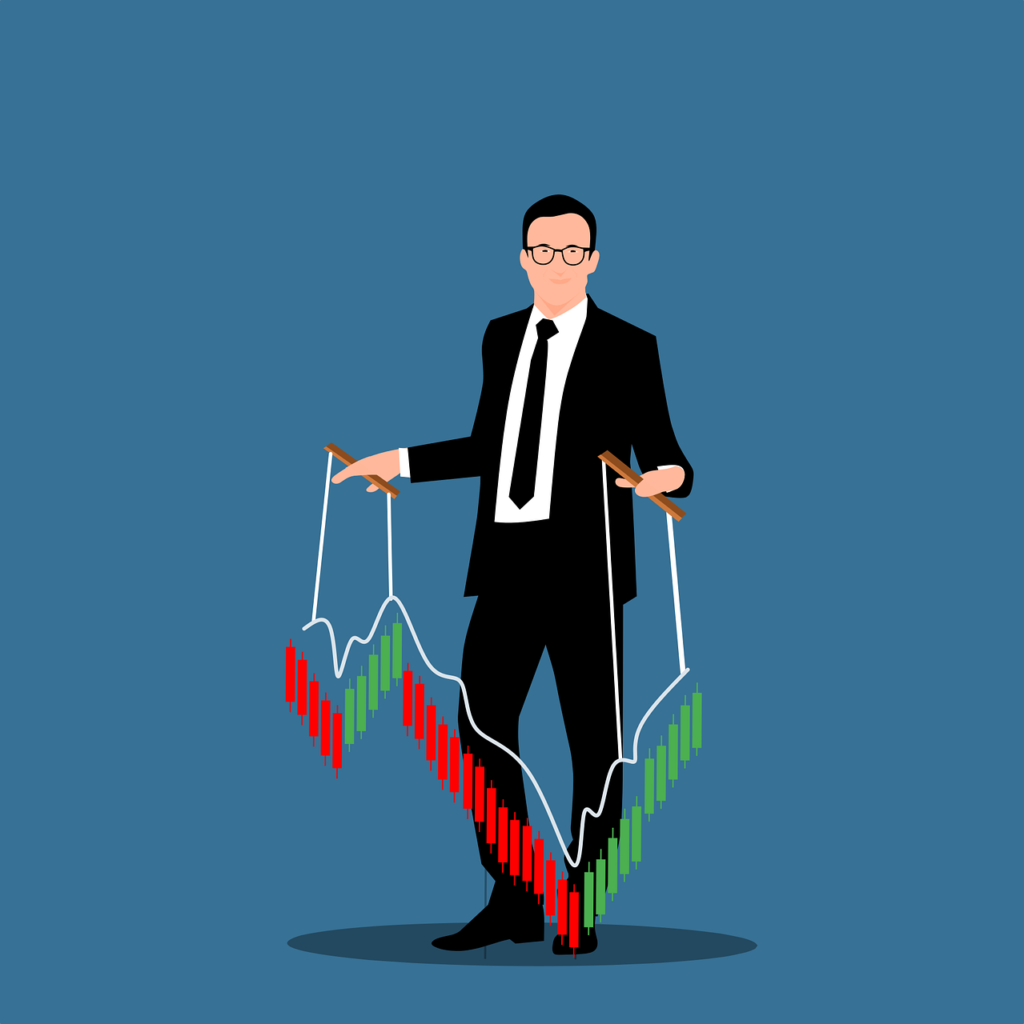
Just as it is easy for us to identify these areas, market makers and institutional traders also target these zones to exploit traders who do not use stop losses,

are impatient, or do not know how to utilize these areas effectively. Market makers can legally manipulate these levels to close their own positions due to the size of their investments.

Warren Buffett once stated that the stock market is a transfer of wealth from the impatient to the patient, highlighting the importance of a disciplined and patient trading approach.

Impulse and Correction: The Power of Price Action

We have identified that the market moves in three trends: uptrend, downtrend, and consolidation trend.

While the market moves in these trends, it’s important to note that it also creates a series of impulse and correction moves.

An impulse move occurs when the price of a currency pair or index covers a wide distance in the market in a short period (buy/sell)

influenced by market volatility. Once you learn the technical approach required to successfully trade impulse moves, you will understand why I say volatility is your friend.

A correction, also known as a pullback or retracement, happens when the market temporarily changes direction to regenerate liquidity before continuing in its intended direction.

I sometimes place my entries (with proper timing and skill) during a correction (law: after a correction follows an impulse) to capitalize on the impulse move.

I will also cover advanced technical trading sessions later.

Conclusion: Mastering Technical Analysis: The Power of Price Action

Mastering technical analysis is about understanding the market’s movements and learning how to interpret price action to make informed trading decisions.

By recognizing bullish, bearish, and consolidation trends, and by strategically using support and resistance levels, retail traders can significantly improve their chances of success.

Remember, patience and discipline are crucial in trading, as highlighted by Warren Buffett.

Embrace the market’s volatility and learn to harness it through impulse and correction moves.

With dedication and the right approach, you can become part of the successful 10% of traders. Let’s embark on this journey together and master the power of price action in technical analysis.

Mindful Trading


Mindful Trading

Mastering mindful trading requires a deep understanding of your emotions.

Forex pairs and indices (stocks) can be highly volatile, with price fluctuations occurring in short periods.

To navigate this volatility effectively, start by practicing with a demo account.

Mindful Trading

Developing the right set of skills will enable you to trade with safety and precision,

leveraging market volatility to close large profits in a short amount of time.

Mindful Trading: Navigating Discouragement

In my four years as a student of the market, I’ve come across many instances

whereby I’ve had my fair share of people who supported me and those who tried to discourage me. Let us look at both of them.

Inspiring Influences in My Life: Positive Energy

In late 2021, I realized the importance of having someone guide me in trading professionally.

There were many moments when I felt stuck,

such as not knowing the best times to trade in my country (South Africa)

or how to determine if the market was bullish or bearish.

Bullish: When the market is rising (price increases).

Bearish: When the market is falling (price decreases).

Mindful Trading
You should aim to master trading both bullish and bearish markets because the market doesn’t always move in one direction. Being versatile and skilled in both types of markets can help you navigate and profit in any market condition.

Today, I look up to my mentors because they continuously motivate me to stay focused and never give up.

Their encouragement has been crucial in my journey to becoming a mindful trader.

I am also deeply grateful for the support from those close to me.

This positive energy helps me persevere and rise above challenges when the going gets tough.

It’s crucial to keep close those who support you, as their positive energy can motivate and help you

stay focused on your journey to becoming a mindful trader.

Navigating Discouragement: Dealing with Detractors in Your Trading Journey

On your journey to becoming a successful trader, you will inevitably encounter people who try to demotivate you.

These detractors can come from anywhere—friends, family, relatives, colleagues.

Always be aware of them and never let their words influence your path. This journey is yours and yours alone.

Overcoming Negativity: The Key to Success in Forex Trading

You might often encounter individuals who have tried trading but gave up

when they realized the forex market isn’t a get-rich-quick scheme.

They tend to project their negative experiences onto you. Be mindful of such individuals.

They might not mean harm; their negativity could stem from their failures, leading them to believe forex is a scam.

It’s crucial not to absorb their negativity, especially as you strive to become a profitable trader.

Some people discourage you simply because they lack knowledge about trading.

They base their judgments on the failures of others. Don’t let their ignorance derail your progress.

Importance of Back Testing: Mindful Trading

I remember the first time I backtested my trading strategy in 2021.

This was my chance to see the progress I had made since starting in 2020.

Back testing essentially tests whether your strategy can endure over time

Mindful Trading

Like farming, trading has its seasons of rain and drought. Skilled and experienced traders navigate these ups and downs

better than those without such skills. Developing your trading skills is essential.

When we get into the practical side of trading, I’ll show you how to back test the strategy I teach.

This will be a fun learning experience because you’ll test the strategy without the fear of losing real money.

It will also help train your subconscious to focus on sharpening your

technical trading skills. Eventually, you’ll be ready to test it out in the real market.

Remember to always have patience

When Should You Start Trading Your First Real Account?

While trading a demo account is essential, you should also start saving to trade your first real account.

This helps you understand how you engage with the market for real.

In the first quarter of 2022, I funded my first account after countless back tests using

Trading View (covered in Technical Trading Lessons). This tool allows you to gain years of experience in a short time.

My journey continued when I funded my first account with $53.20 (R1,000). By this time, I had honed my skills and felt confident.

I initially only traded the Nasdaq 100, an index consisting of the 100 most publicly traded companies.

According to Nasdaq.com, the top 10 most publicly traded companies include:

Microsoft (MSFT)
Alphabet Inc. Class C and Class A (GOOG, GOOGL)
Amazon.com Inc. (AMZN)
Tesla Inc. (TSLA)
Meta Platforms Inc. (META)
NVIDIA Corporation (NVDA)
PepsiCo Inc. (PEP)
Costco Wholesale Corporation (COST)
Apple Inc. (AAPL)
Broadcom Inc. (AVGO)

While trading the Nasdaq 100, I managed to flip my account, doubling it to $106.40 (R2,000) within a week.

The market provided countless setups that respected our price action strategy, leading to a streak of winning trades.

I withdrew my initial deposit of $53.20 that same week on Friday, just before my broker closed shop. That weekend,

I was excited and nervous—excited because I had flipped my account for the first time since 2020,

and nervous because it was my first time withdrawing money from my brokerage.

I remained patient, ensuring my emotions didn’t cloud my judgment.

On Tuesday at 10 AM, I received a notification from the bank confirming the deposit of $53.20 from my brokerage.

This was a turning point in my life, making me realize the potential of forex.

By not giving up, you can make significant progress in the world of trading.

Over time, consistency will enable you to see your growth as a retail trader.

Remember, just as it takes time to see progress when lifting weights for the first time,

Mindful Trading

Mastering your trading skills will develop based on your consistency.

A trader who makes the most mistakes will always outshine the one who does not, as long as they learn from their mistakes.

How Much Should You Fund Your First Account?

It’s ideal to start your trading journey by funding your account with anywhere from $53.20 to $159.61.(small account/mini accounts).

Small accounts help you worry less about blowing your account, especially when starting out.

When I first flipped my account and withdrew my initial deposit, I felt invincible, and my confidence soared.

After receiving my initial deposit, I started trading again, but this time things were different.

Understanding FOMO: Never Break Your Trading Rules

When I reopened Nasdaq and began analyzing, the market wasn’t giving the same setups as the previous weeks.

The market was not trending, meaning there were fewer opportunities.

I was unaware of this and let my judgment be clouded by the desire to flip my account again within a week.

Remember, there are times when the market gives, and times when the market takes.

We harvest at the end of a trending market and let it play out during a drought (choppy market).

A choppy market shows no clear trend, making small fluctuations in a short period.

It is when the price of a stock, currency pair, or commodity is indecisive.

During this time, the market gains liquidity by taking out impatient retail traders.

The elusive 10% of traders wait out the drought and emerge when the market trends again. I didn’t know this at the time.

Mindful Trading

All I could think about was flipping my account. I opened my trading platform and started analyzing Nasdaq again,

but this time the market wasn’t offering any high-probability buys or sells. Instead of avoiding the choppy market,

I was filled with a new emotion: FOMO (Fear of Missing Out). I didn’t like the idea of waiting because I thought if I waited,

I would miss out on an opportunity to capitalize on the market.

This impatience led me to lose 80% of my account. After this, I went back to the drawing board.

Keep in mind, I still had the $53.20 I had withdrawn. Instead of funding my reserves, I wanted to see what went wrong.

So, I back tested for a few hours until I realized I should not have entered the market.

This lesson taught me the power of back testing, testing a strategy with a small account, and differentiating between a trending market and a choppy market.

Conclusion: Mindful Trading

Remember, trading requires patience and a mindful approach. By funding a small account,

you can manage your risk better and learn valuable lessons without significant financial loss.

Always back test your strategies and understand market conditions before making trades.

This mindful approach will help you navigate the ups and downs of the trading world successfully.

Now that you are aware of the emotions you may encounter on your journey to becoming a mindful trader,

you are better suited to navigate your way more effectively than I did when I began my journey.

Next, we will delve into the practical side of trading—the fun part—where we’ll explore how to trade

using trend channels, support, and resistance levels and zones. Stay tuned for a lot of quality content designed to sharpen your skills. See you there!